Key components
three key components of a ggplot2 plot
e.g.
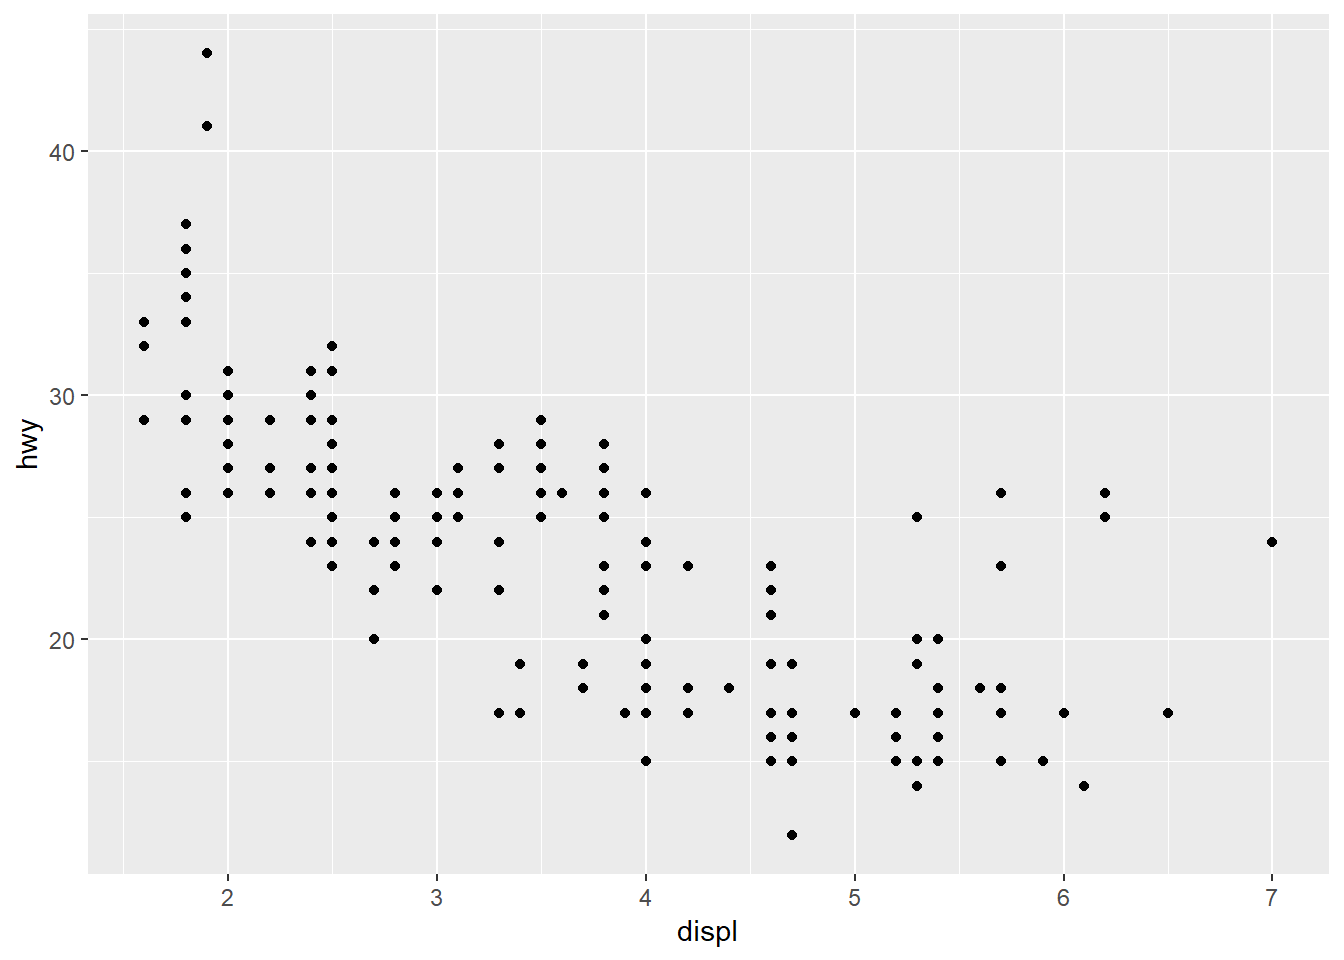
ggplot(data = mpg, aes(displ, hwy)) +
  geom_point()

ggplot() +
  geom_point(data = mpg, aes(x = displ, y = hwy))
ggplot() +
  geom_point(data = mpg, mapping = aes(x = displ, y = hwy))

ggplot() +
  geom_point(data = mpg, mapping = aes(x = displ, y = hwy))

ggplot(data = midwest) +
  geom_point(data = mpg, aes(x = displ, y = hwy))