Colour, size, shape and other aesthetic attributes
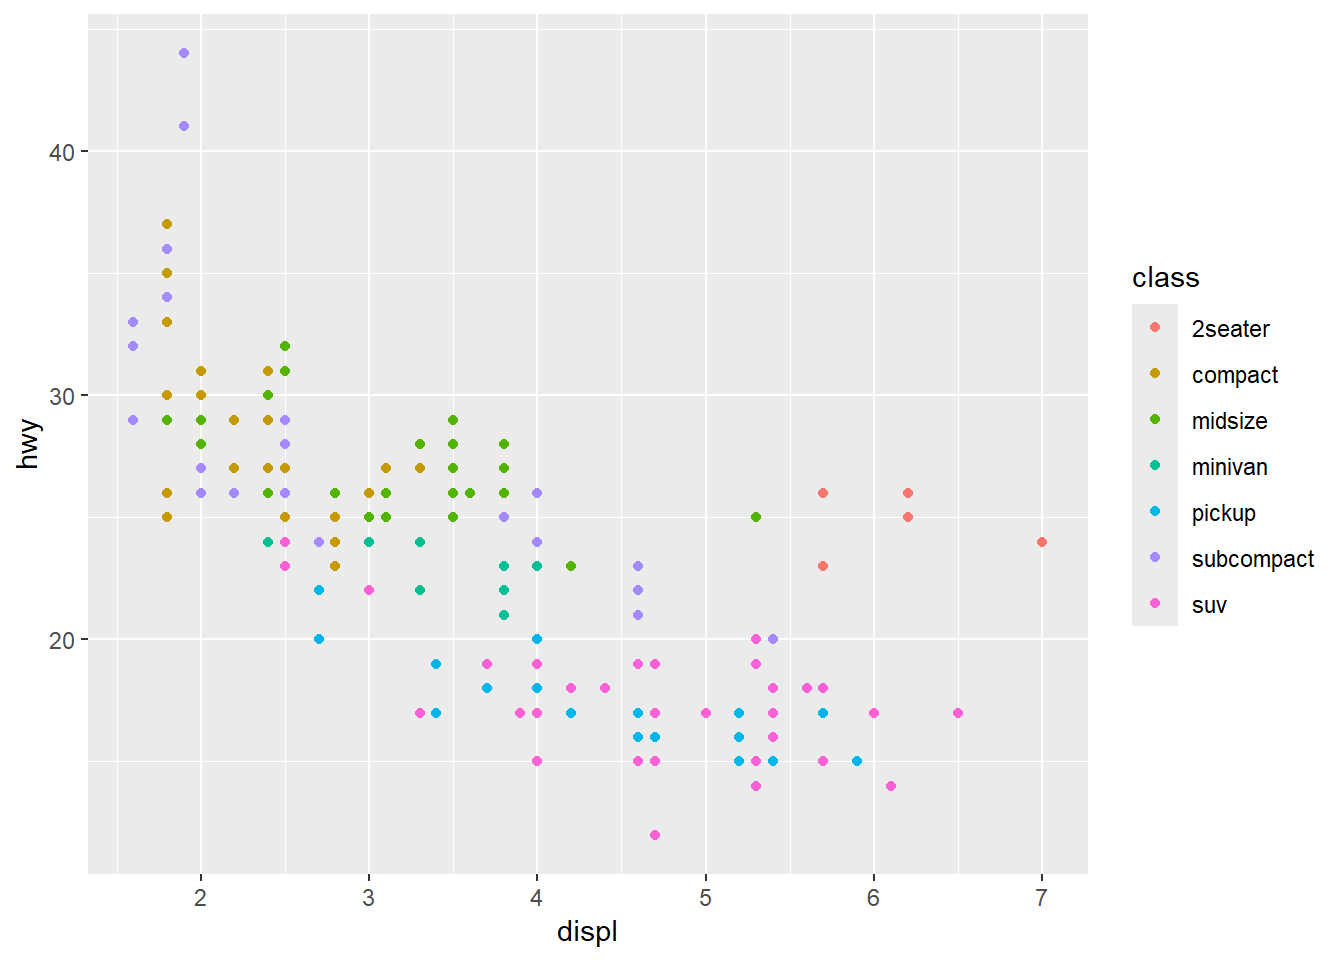
- ggplot2 takes care of the details of converting data (e.g., ‘f’, ‘r’, ‘4’) into aesthetics (e.g., ‘red’, ‘yellow’, ‘green’) with a scale.
ggplot(mpg, aes(displ, hwy, colour = class)) +
  geom_point()
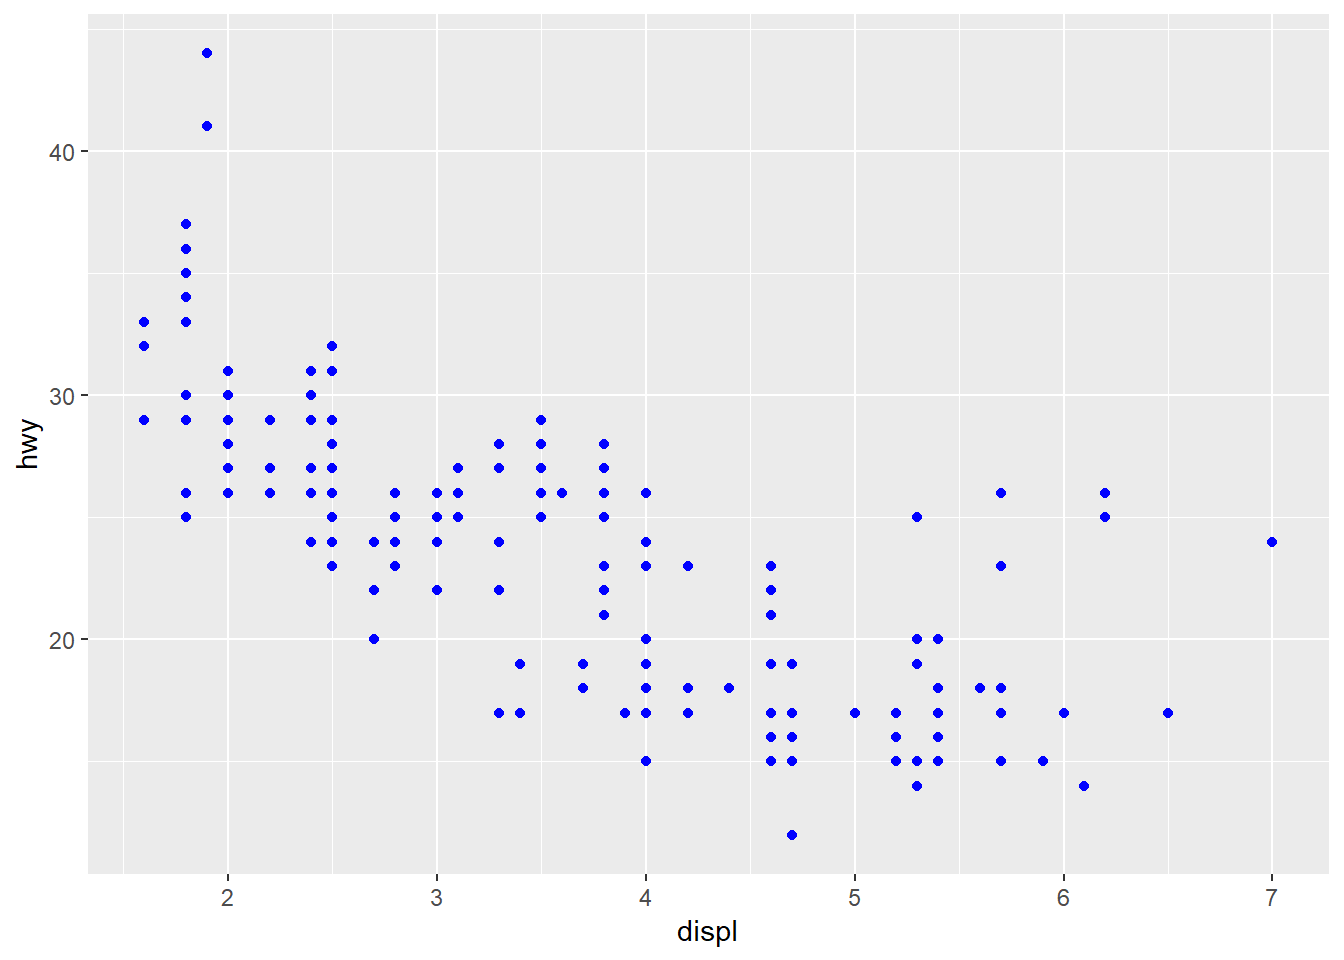
ggplot(mpg, aes(displ, hwy)) + geom_point(colour = "blue")
ggplot(mpg, aes(displ, hwy)) + geom_point(aes(colour = "blue"))
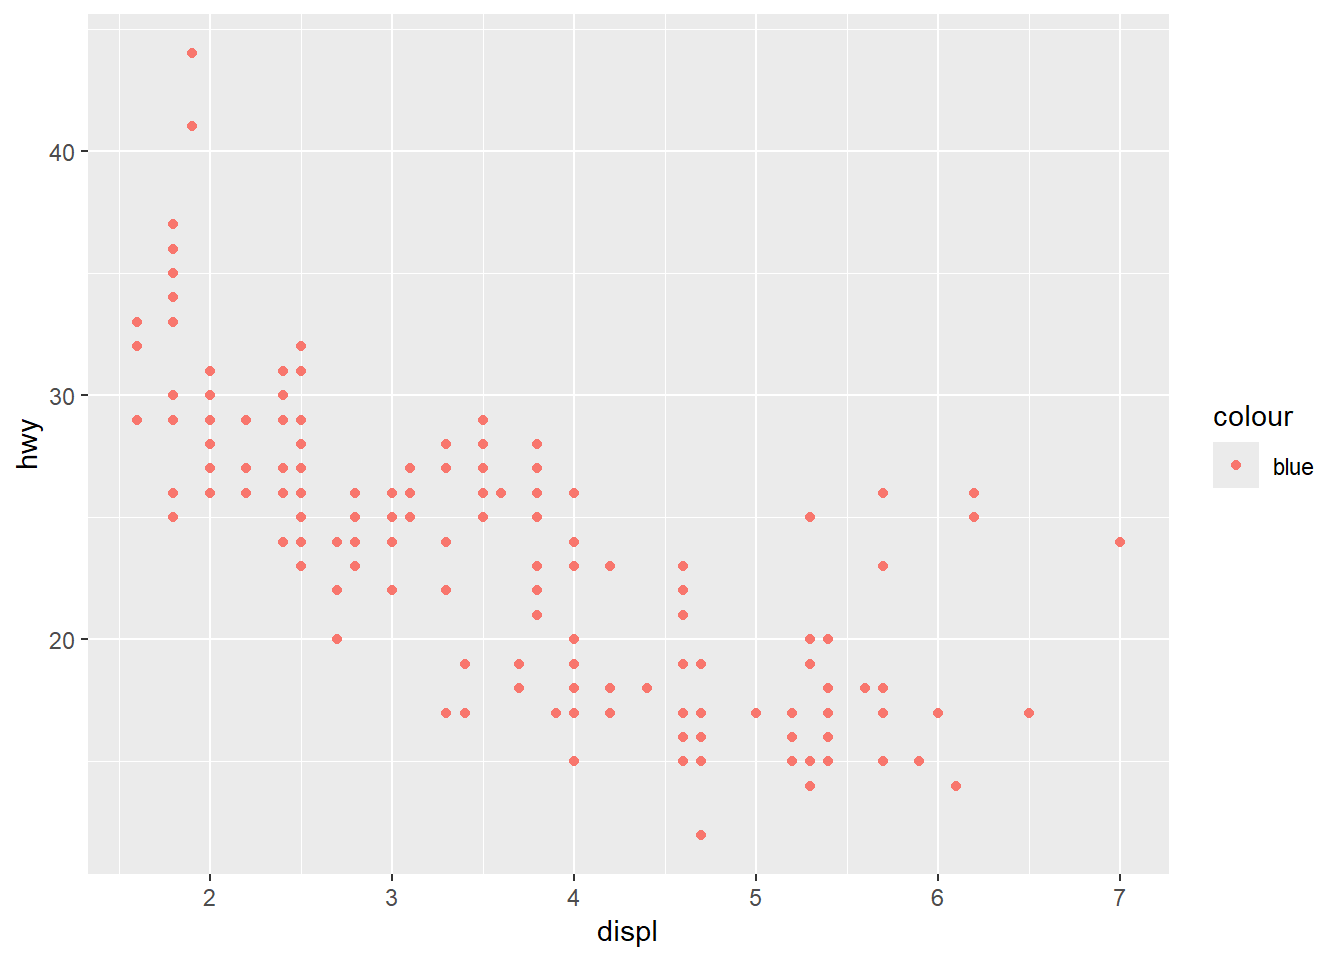
- the second plots doesn’t have a legend
- think about how to colour
- tell a story
- less is more!