Exercises
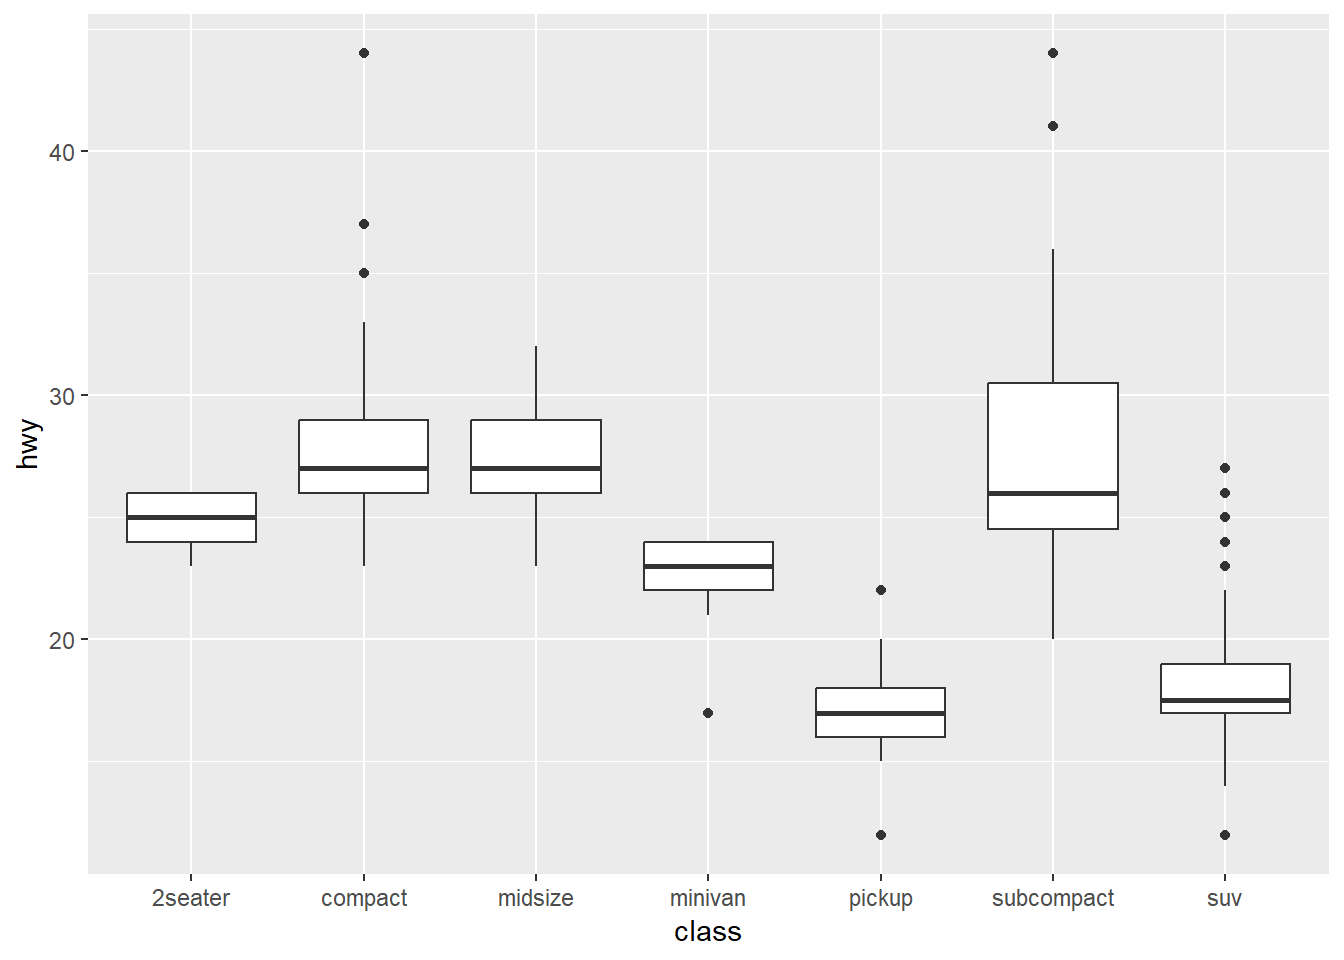
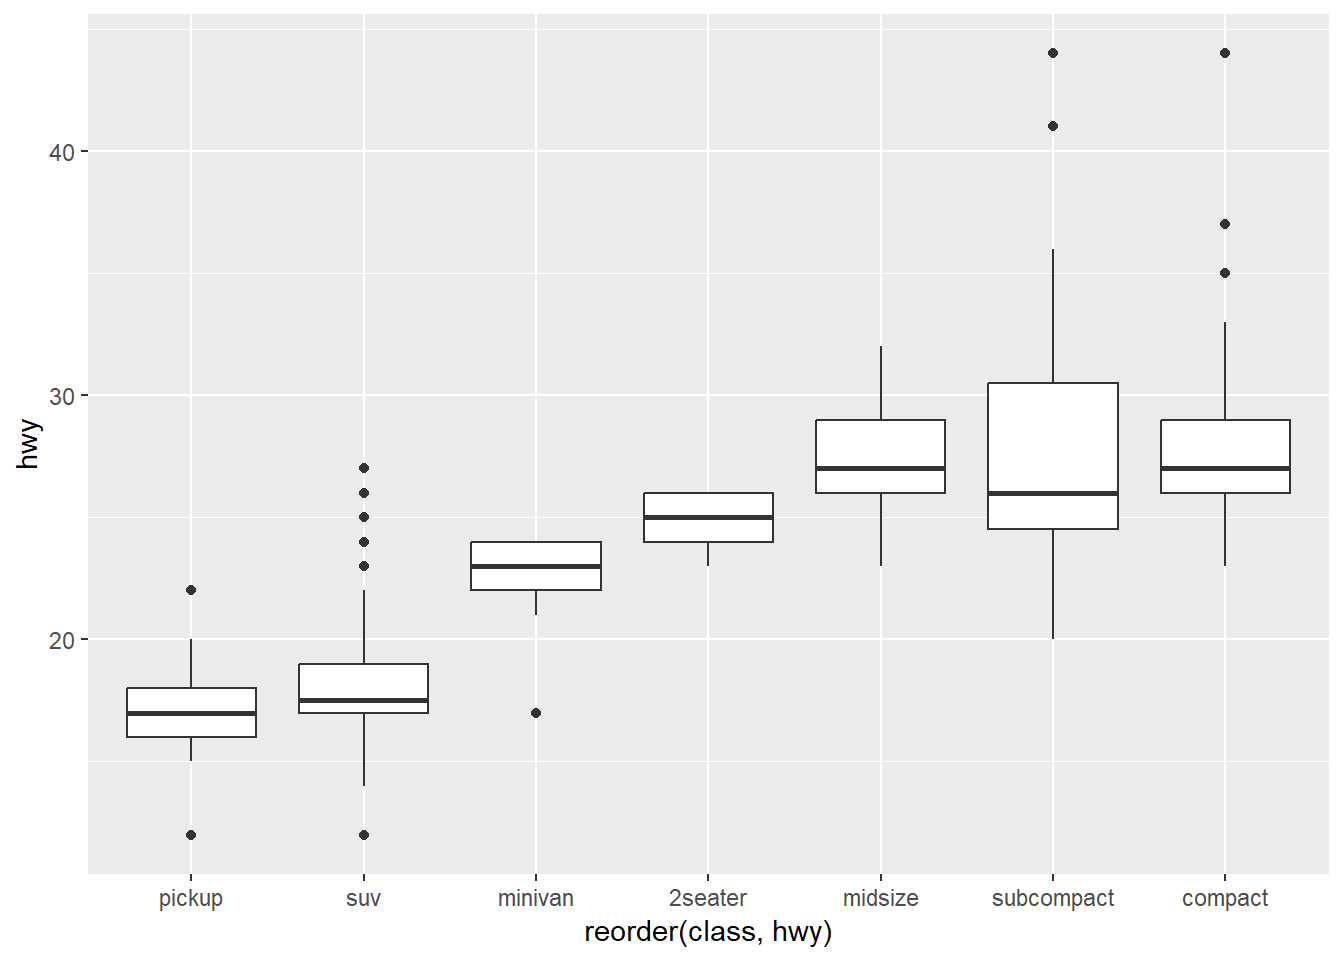
By default, reorder() sorts the factor levels by the median
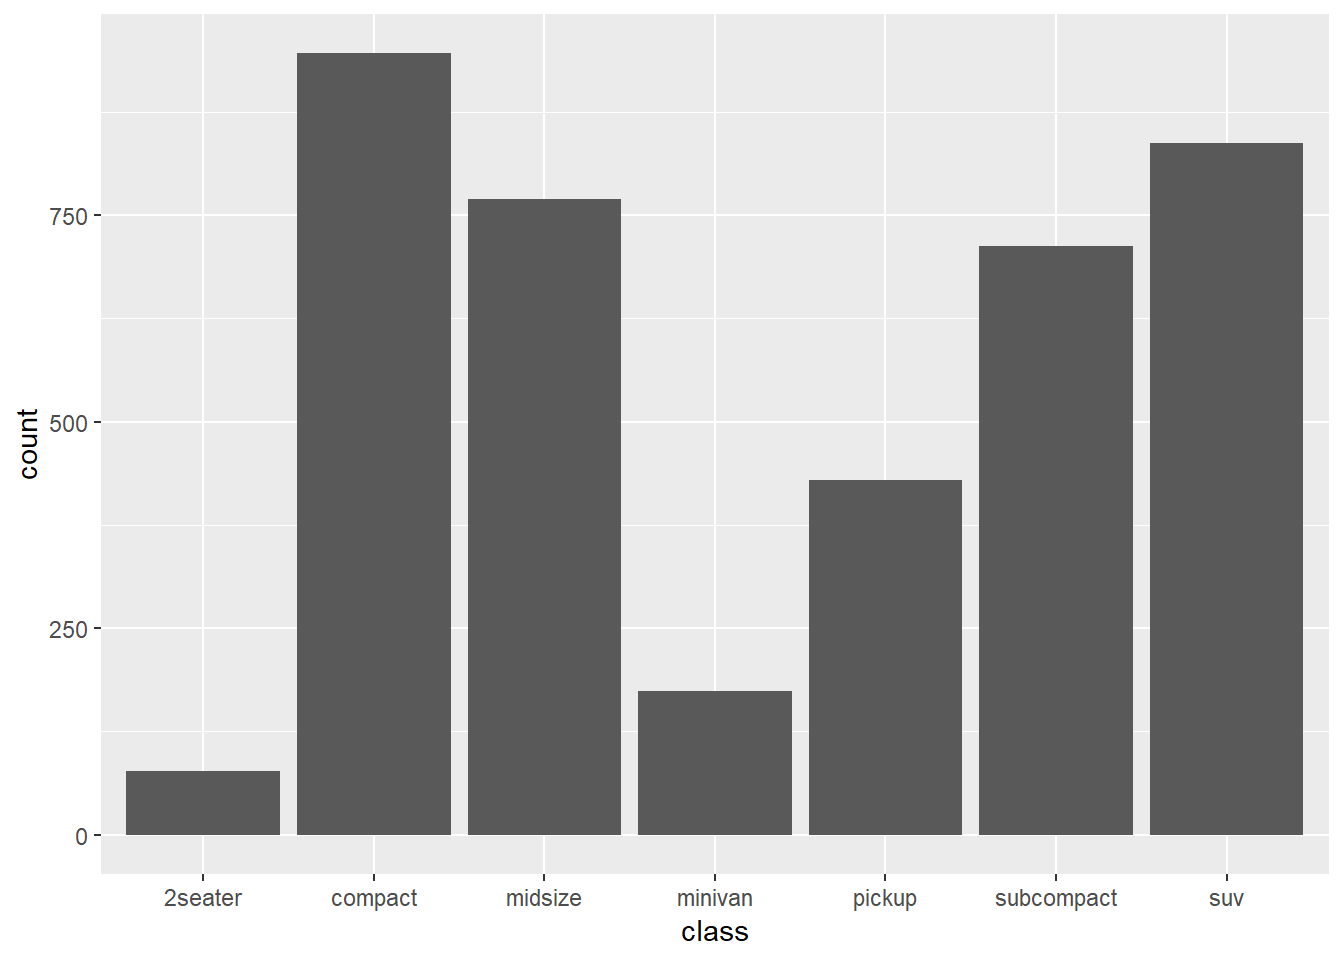
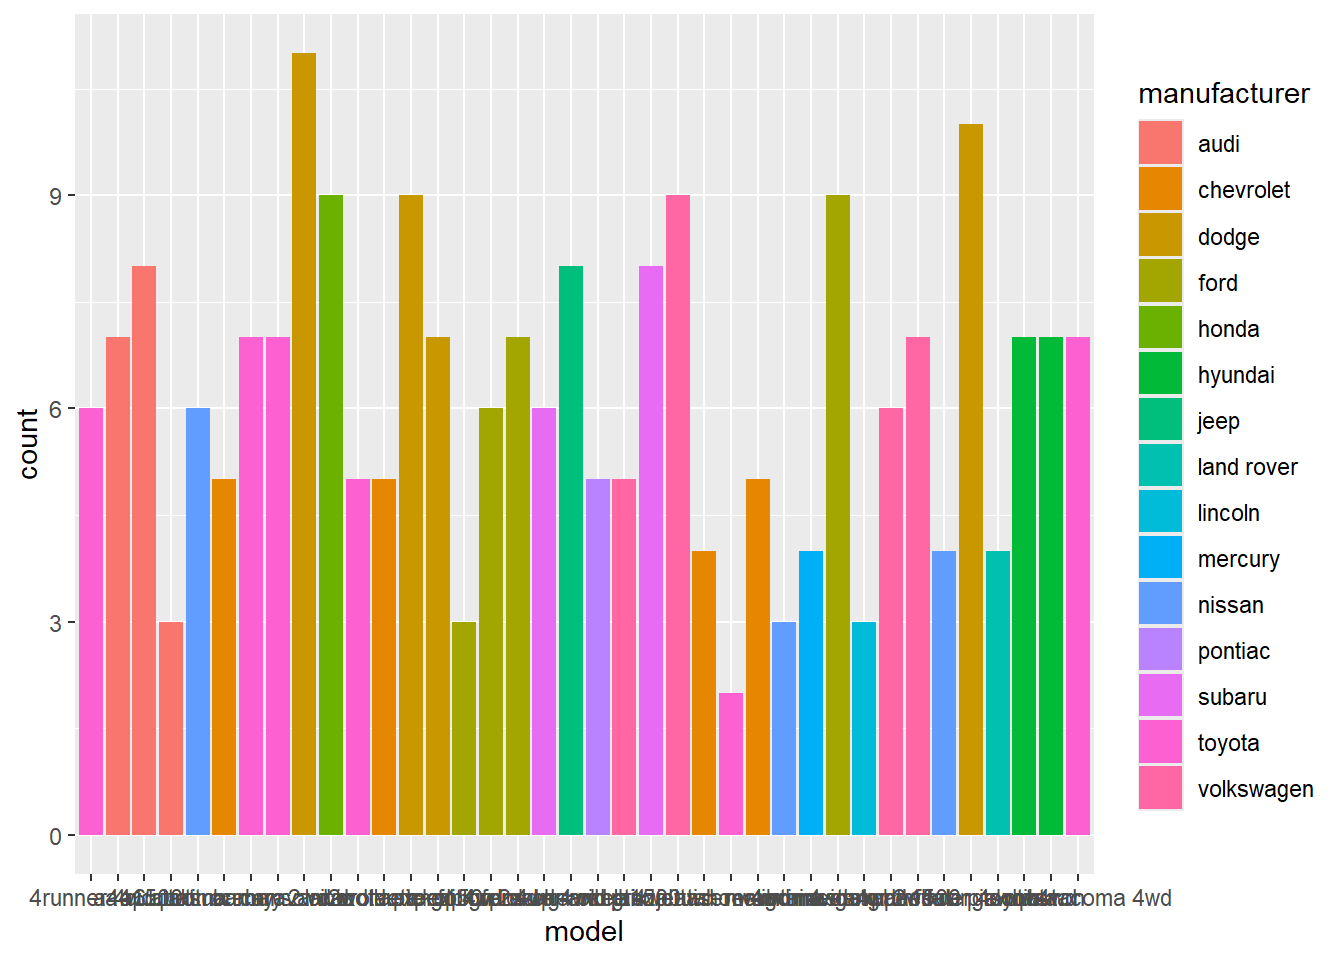
The weight aesthetic in geom_bar() allows you to specify the weight or frequency for each observation
library(dplyr)
# summarized data frame
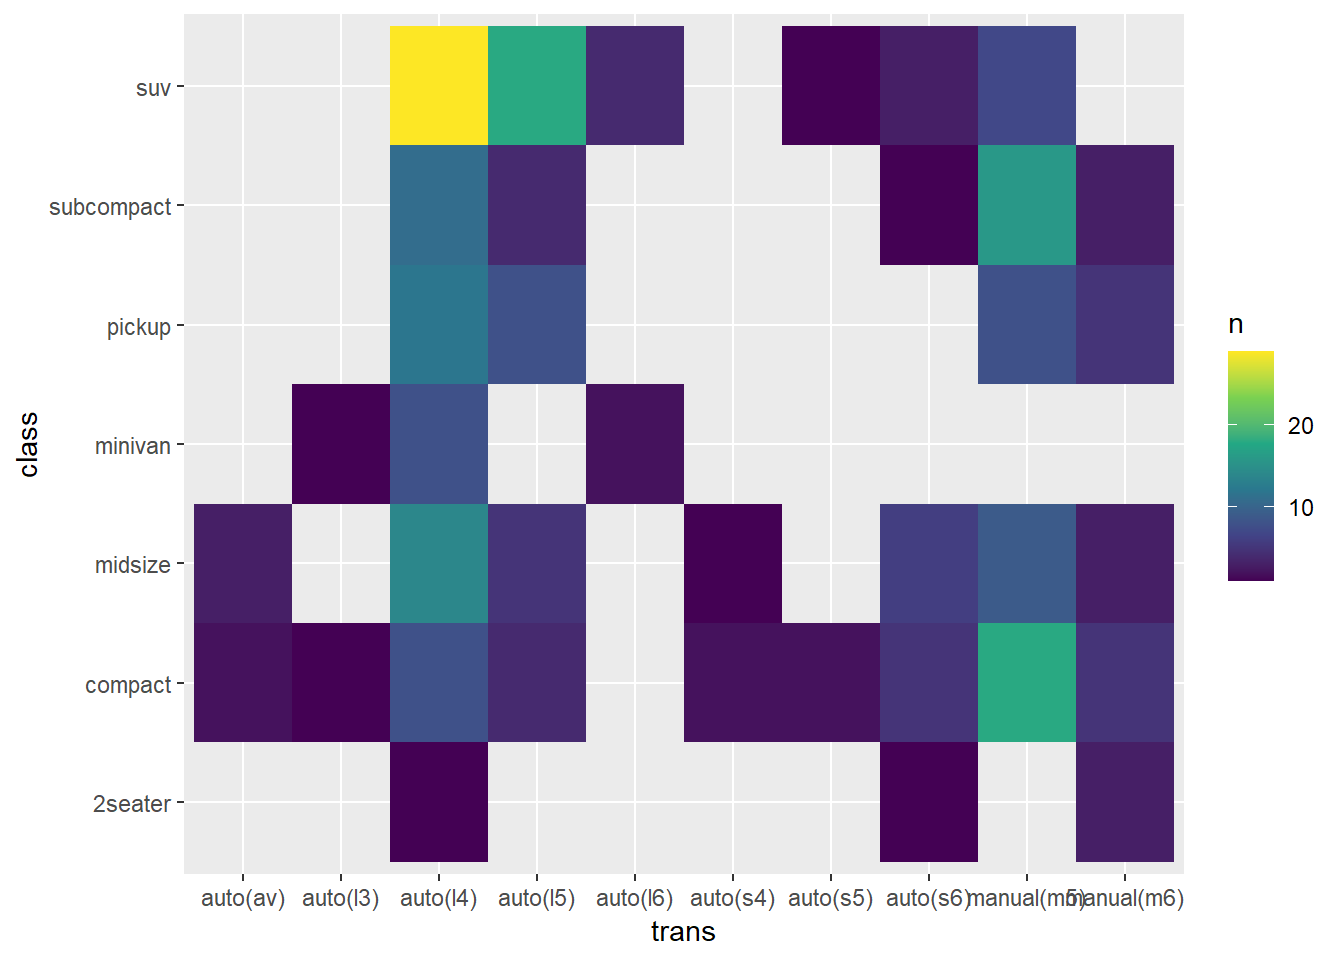
summary_data <- mpg %>%
count(trans, class)
# heatmap-like plot using geom_tile
ggplot(summary_data, aes(x = trans, y = class)) +
geom_tile(aes(fill = n), width = 1, height = 1)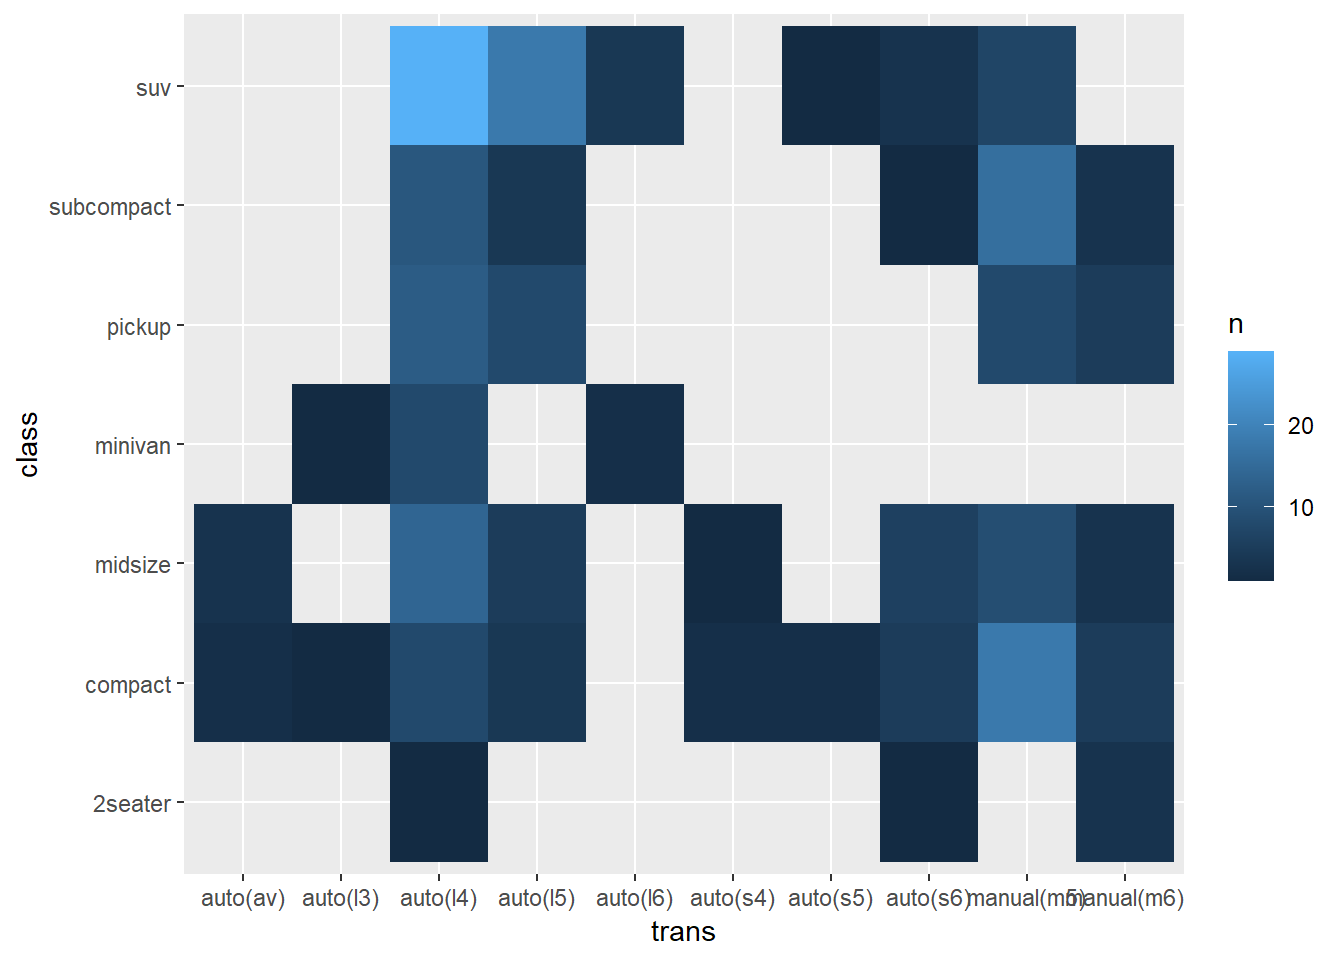
ggplot(summary_data, aes(x = trans, y = class)) +
  geom_tile(aes(fill = n), width = 1, height = 1) +
  scale_fill_viridis_c()