Cost-Effectiveness Analysis When Multiple (Possibly Non-Cost-Effective) Interventions are Present on the Market
Source:R/mixedAn.R
mixedAn-set.RdRuns the cost-effectiveness analysis, but accounts for the fact that more than one intervention is present on the market.
Arguments
- he
A
bceaobject containing the results of the Bayesian modelling and the economic evaluation.- value
A vector of market shares associated with the interventions. Its size is the same as the number of possible comparators. By default, assumes uniform distribution for each intervention.
Value
Creates an object in the class mixedAn, a subclass of bcea
which contains the results of the health economic evaluation in the mixed analysis case:
- Ubar
An array with the simulations of the ''known-distribution'' mixed utilities, for each value of the discrete grid approximation of the willingness to pay parameter
- OL.star
An array with the simulations of the distribution of the Opportunity Loss for the mixed strategy, for each value of the discrete grid approximation of the willingness to pay parameter
- evi.star
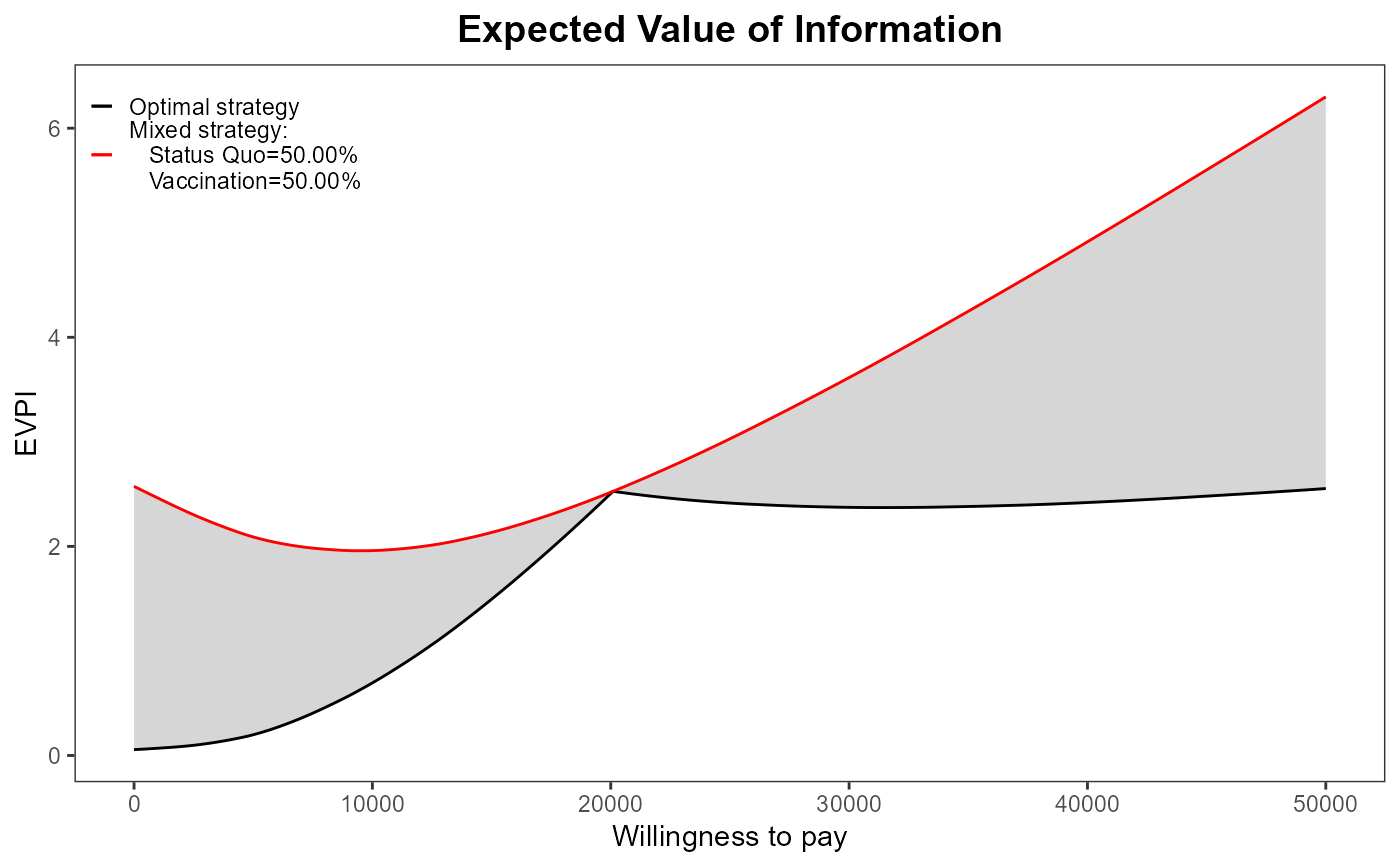
The Expected Value of Information for the mixed strategy, for each value of the discrete grid approximation of the willingness to pay parameter
- mkt.shares
The vector of market shares associated with each available intervention
References
Baio G, Russo P (2009). “A decision-theoretic framework for the application of cost-effectiveness analysis in regulatory processes.” Pharmacoeconomics, 27(8), 5--16. ISSN 20356137, doi:10.1007/bf03320526 .
Baio G, Dawid aP (2011). “Probabilistic sensitivity analysis in health economics.” Stat. Methods Med. Res., 1--20. ISSN 1477-0334, doi:10.1177/0962280211419832 , https://pubmed.ncbi.nlm.nih.gov/21930515/.
Baio G (2013). Bayesian Methods in Health Economics. CRC.
Examples
# See Baio G., Dawid A.P. (2011) for a detailed description of the
# Bayesian model and economic problem

# Load the processed results of the MCMC simulation model
data(Vaccine)

# Runs the health economic evaluation using BCEA
m <- bcea(e=eff, c=cost,    # defines the variables of
                            #  effectiveness and cost
      ref=2,                # selects the 2nd row of (e, c)
                            #  as containing the reference intervention
      interventions=treats, # defines the labels to be associated
                            #  with each intervention
      Kmax=50000,           # maximum value possible for the willingness
                            #  to pay threshold; implies that k is chosen
                            #  in a grid from the interval (0, Kmax)
      plot=FALSE)           # inhibits graphical output

mixedAn(m) <- NULL      # uses the results of the mixed strategy
                        #  analysis (a "mixedAn" object)
                        # the vector of market shares can be defined
                        #  externally. If NULL, then each of the T
                        #  interventions will have 1/T market share
                        # produces the plots
evi.plot(m)
