Introduction
The line connecting successive points on a cost-effectiveness plane which each represent the effect and cost associated with different treatment alternatives. The gradient of a line segment represents the ICER of the treatment comparison between the two alternatives represented by that segment. The cost-effectiveness frontier consists of the set of points corresponding to treatment alternatives that are considered to be cost-effective at different values of the cost-effectiveness threshold. The steeper the gradient between successive points on the frontier, the higher is the ICER between these treatment alternatives and the more expensive alternative would be considered cost-effective only when a high value of the cost-effectiveness threshold is assumed. Points not lying on the cost-effectiveness frontier represent treatment alternatives that are not considered cost-effective at any value of the cost-effectiveness threshold.
R code
To create the plots in BCEA we first call the bcea()
function.
data(Smoking)

treats <- c("No intervention", "Self-help", "Individual counselling", "Group counselling")
bcea_smoke <- bcea(eff, cost, ref = 4, interventions = treats, Kmax = 500)- base R
# all interventions
ceef.plot(bcea_smoke)
#>
#> Cost-effectiveness efficiency frontier summary
#>
#> Interventions on the efficiency frontier:
#>                   Effectiveness   Costs Increase slope Increase angle
#> Self-help               0.28824  45.733         158.66         1.5645
#> Group counselling       0.72252 143.301         224.67         1.5663
#>
#> Interventions not on the efficiency frontier:
#>                        Effectiveness  Costs     Dominance type
#> No intervention              0.00000  0.000 Extended dominance
#> Individual counselling       0.48486 94.919 Extended dominance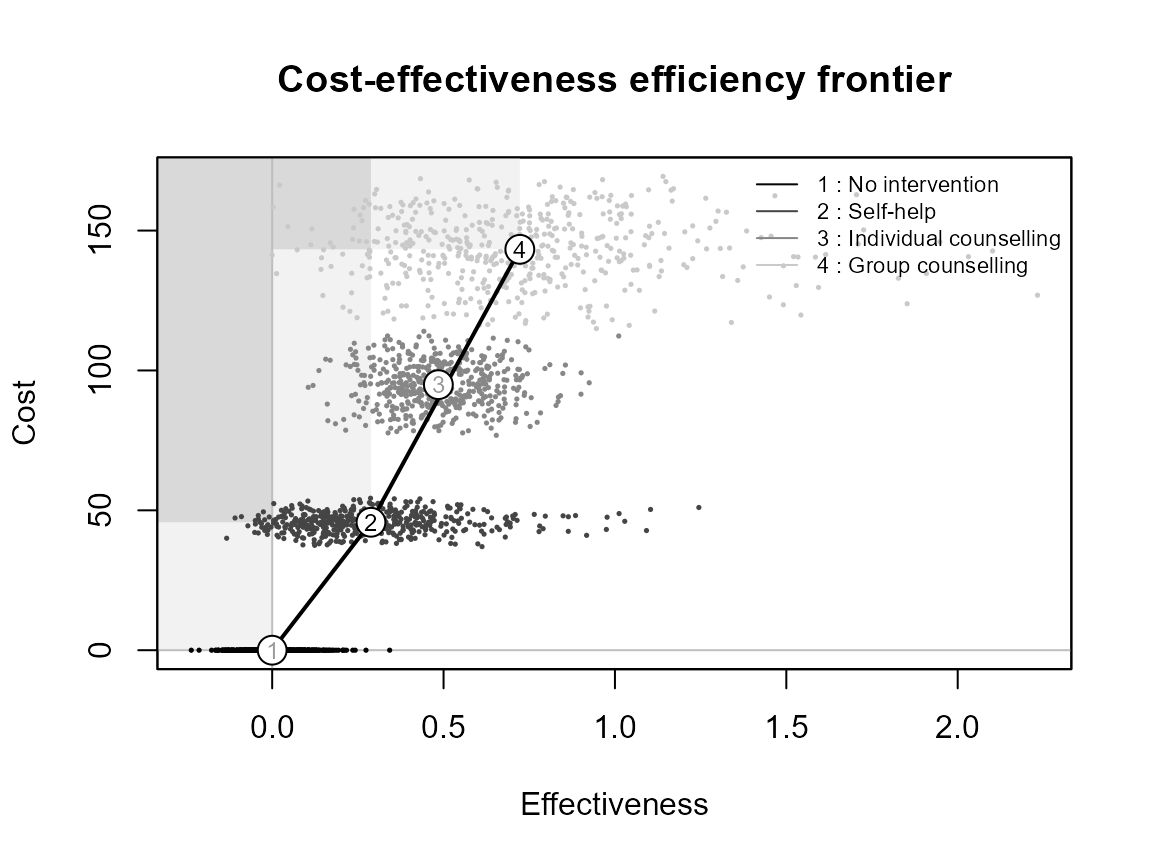
# subset
setComparisons(bcea_smoke) <- c(1,3)
ceef.plot(bcea_smoke)
#>
#> Cost-effectiveness efficiency frontier summary
#>
#> Interventions on the efficiency frontier:
#>                        Effectiveness   Costs Increase slope Increase angle
#> Self-help                    0.48486  94.919         195.77         1.5657
#> Individual counselling       0.72252 143.301         203.57         1.5659
#>
#> Interventions not on the efficiency frontier:
#>                 Effectiveness Costs     Dominance type
#> No intervention             0     0 Extended dominance
# check numbering and legend
setComparisons(bcea_smoke) <- c(3,1)
ceef.plot(bcea_smoke)
#>
#> Cost-effectiveness efficiency frontier summary
#>
#> Interventions on the efficiency frontier:
#>                        Effectiveness   Costs Increase slope Increase angle
#> Self-help                    0.48486  94.919         195.77         1.5657
#> Individual counselling       0.72252 143.301         203.57         1.5659
#>
#> Interventions not on the efficiency frontier:
#>                 Effectiveness  Costs     Dominance type
#> No intervention       0.48486 94.919 Extended dominance
setComparisons(bcea_smoke) <- c(3,2)
ceef.plot(bcea_smoke)
#>
#> Cost-effectiveness efficiency frontier summary
#>
#> Interventions on the efficiency frontier:
#>                        Effectiveness  Costs Increase slope Increase angle
#> Individual counselling       0.43428 97.568         224.67         1.5663
#>
#> Interventions not on the efficiency frontier:
#>                 Effectiveness  Costs     Dominance type
#> No intervention       0.19662 49.186 Extended dominance
#> Self-help             0.00000  0.000 Extended dominance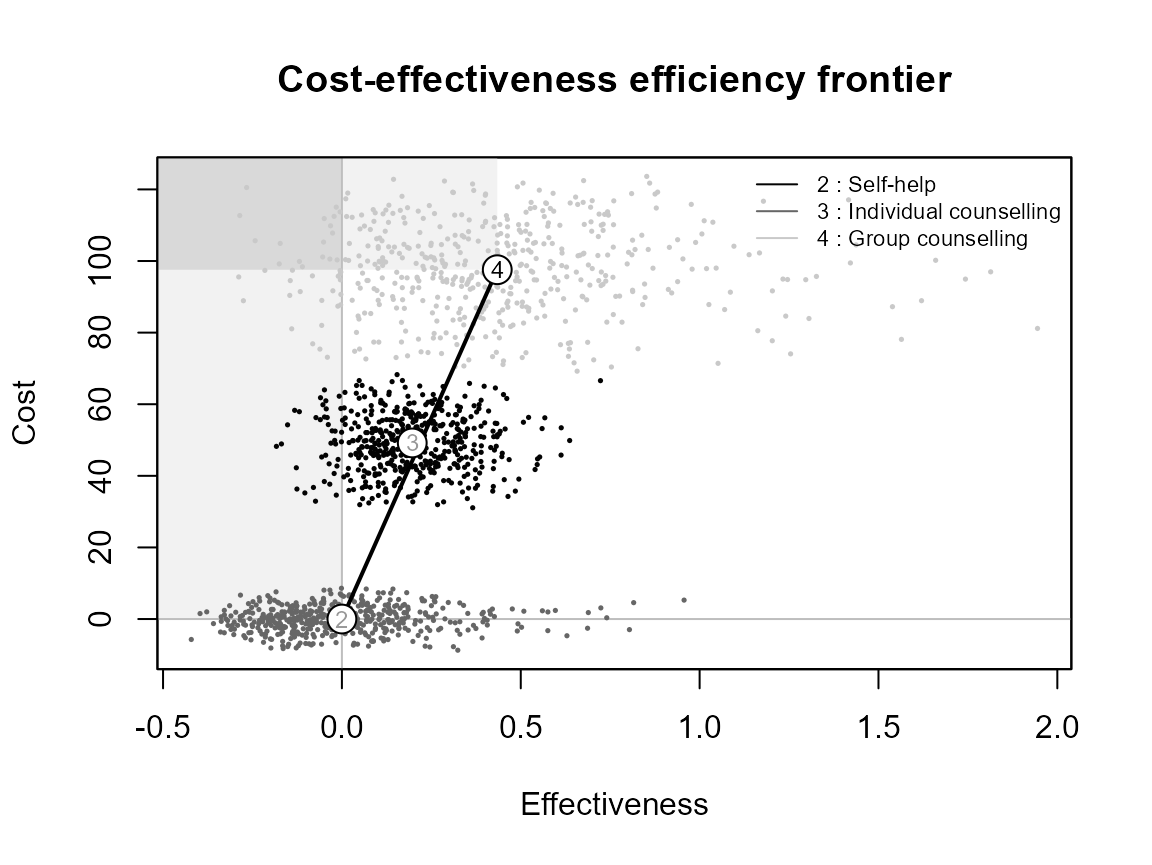
setComparisons(bcea_smoke) <- 1
ceef.plot(bcea_smoke)
#>
#> Cost-effectiveness efficiency frontier summary
#>
#> Interventions on the efficiency frontier:
#>           Effectiveness Costs Increase slope Increase angle
#> Self-help       0.72252 143.3         198.33         1.5658
#>
#> Interventions not on the efficiency frontier:
#>                 Effectiveness Costs     Dominance type
#> No intervention             0     0 Extended dominance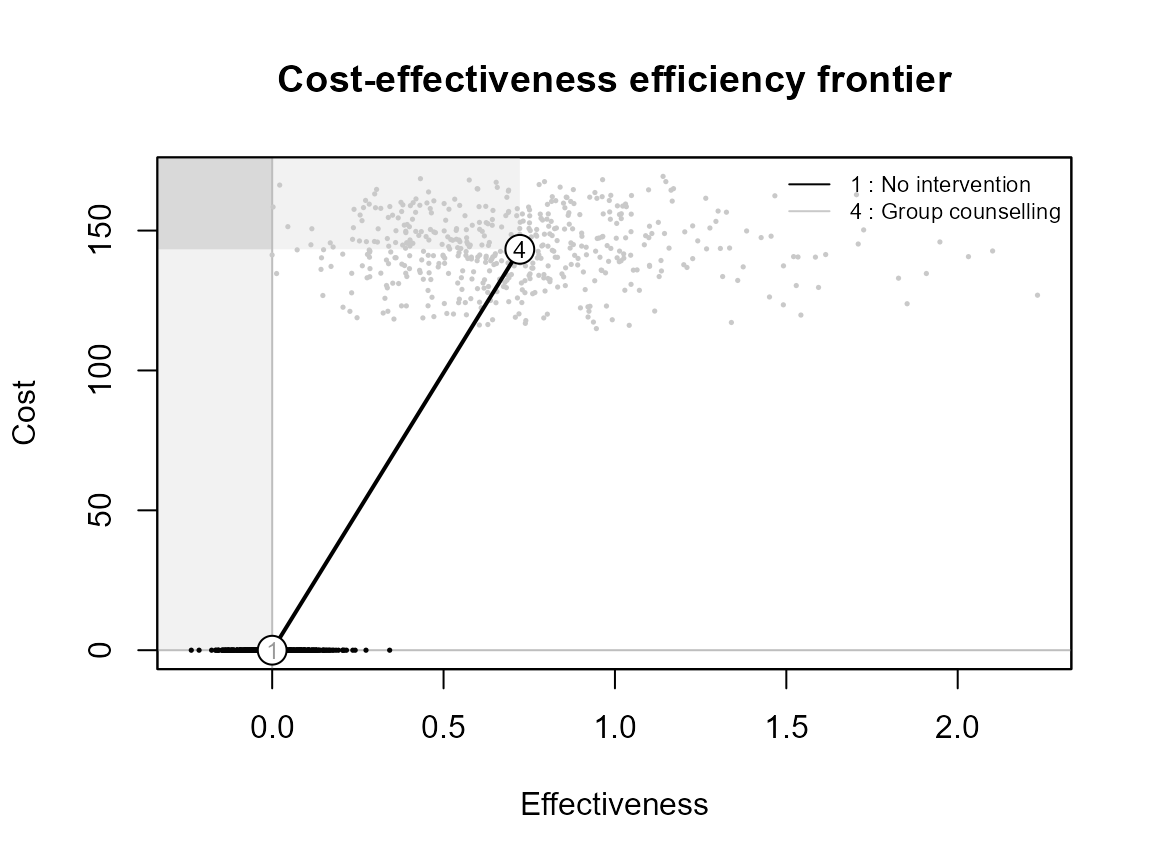
# add interventions back in
setComparisons(bcea_smoke) <- c(1,3)
ceef.plot(bcea_smoke)
#>
#> Cost-effectiveness efficiency frontier summary
#>
#> Interventions on the efficiency frontier:
#>                        Effectiveness   Costs Increase slope Increase angle
#> Self-help                    0.48486  94.919         195.77         1.5657
#> Individual counselling       0.72252 143.301         203.57         1.5659
#>
#> Interventions not on the efficiency frontier:
#>                 Effectiveness Costs     Dominance type
#> No intervention             0     0 Extended dominance
- ggplot
bcea_smoke <- bcea(eff, cost, ref = 4, interventions = treats, Kmax = 500)

# all interventions
ceef.plot(bcea_smoke, graph = "ggplot")
#>
#> Cost-effectiveness efficiency frontier summary
#>
#> Interventions on the efficiency frontier:
#>                   Effectiveness   Costs Increase slope Increase angle
#> Self-help               0.28824  45.733         158.66         1.5645
#> Group counselling       0.72252 143.301         224.67         1.5663
#>
#> Interventions not on the efficiency frontier:
#>                        Effectiveness  Costs     Dominance type
#> No intervention              0.00000  0.000 Extended dominance
#> Individual counselling       0.48486 94.919 Extended dominance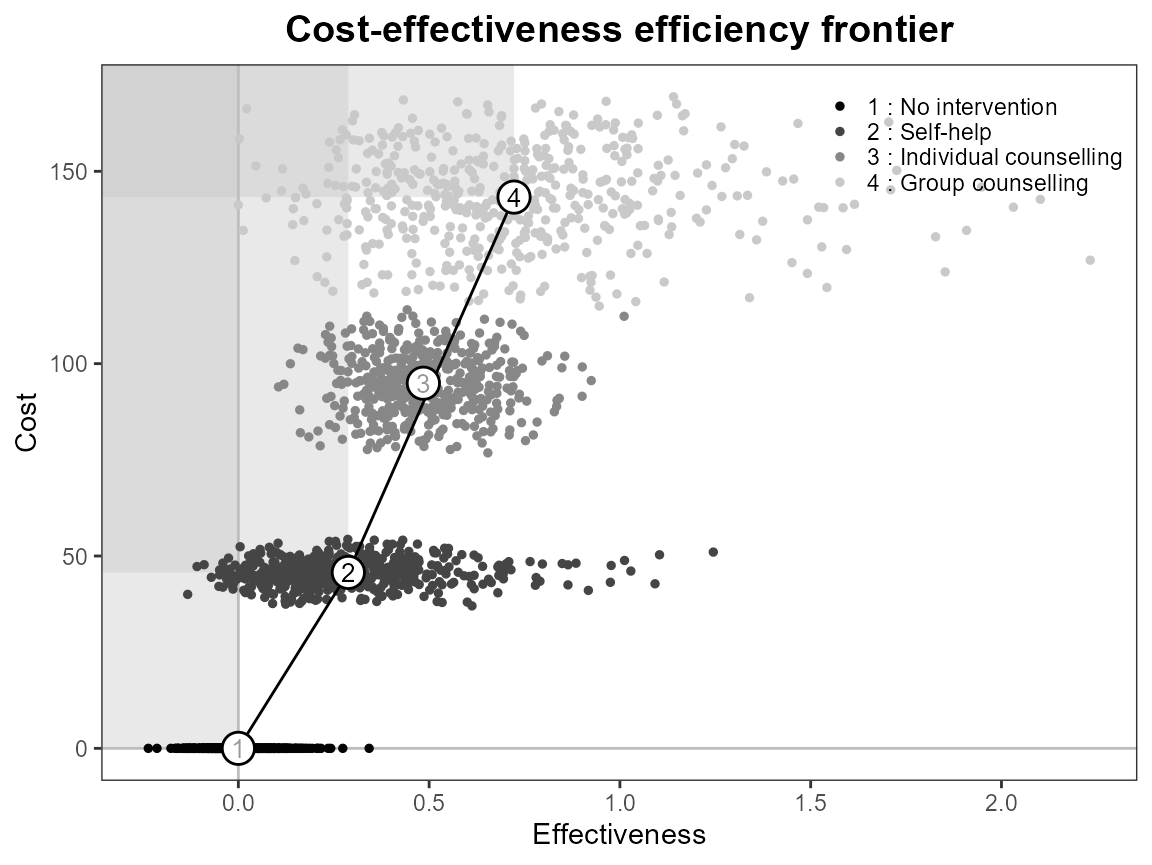
# subset
setComparisons(bcea_smoke) <- c(1,3)
ceef.plot(bcea_smoke, graph = "ggplot")
#>
#> Cost-effectiveness efficiency frontier summary
#>
#> Interventions on the efficiency frontier:
#>                        Effectiveness   Costs Increase slope Increase angle
#> Self-help                    0.48486  94.919         195.77         1.5657
#> Individual counselling       0.72252 143.301         203.57         1.5659
#>
#> Interventions not on the efficiency frontier:
#>                 Effectiveness Costs     Dominance type
#> No intervention             0     0 Extended dominance
# check numbering and legend
setComparisons(bcea_smoke) <- c(3,1)
ceef.plot(bcea_smoke, graph = "ggplot")
#>
#> Cost-effectiveness efficiency frontier summary
#>
#> Interventions on the efficiency frontier:
#>                        Effectiveness   Costs Increase slope Increase angle
#> Self-help                    0.48486  94.919         195.77         1.5657
#> Individual counselling       0.72252 143.301         203.57         1.5659
#>
#> Interventions not on the efficiency frontier:
#>                 Effectiveness  Costs     Dominance type
#> No intervention       0.48486 94.919 Extended dominance
setComparisons(bcea_smoke) <- c(3,2)
ceef.plot(bcea_smoke, graph = "ggplot")
#>
#> Cost-effectiveness efficiency frontier summary
#>
#> Interventions on the efficiency frontier:
#>                        Effectiveness  Costs Increase slope Increase angle
#> Individual counselling       0.43428 97.568         224.67         1.5663
#>
#> Interventions not on the efficiency frontier:
#>                 Effectiveness  Costs     Dominance type
#> No intervention       0.19662 49.186 Extended dominance
#> Self-help             0.00000  0.000 Extended dominance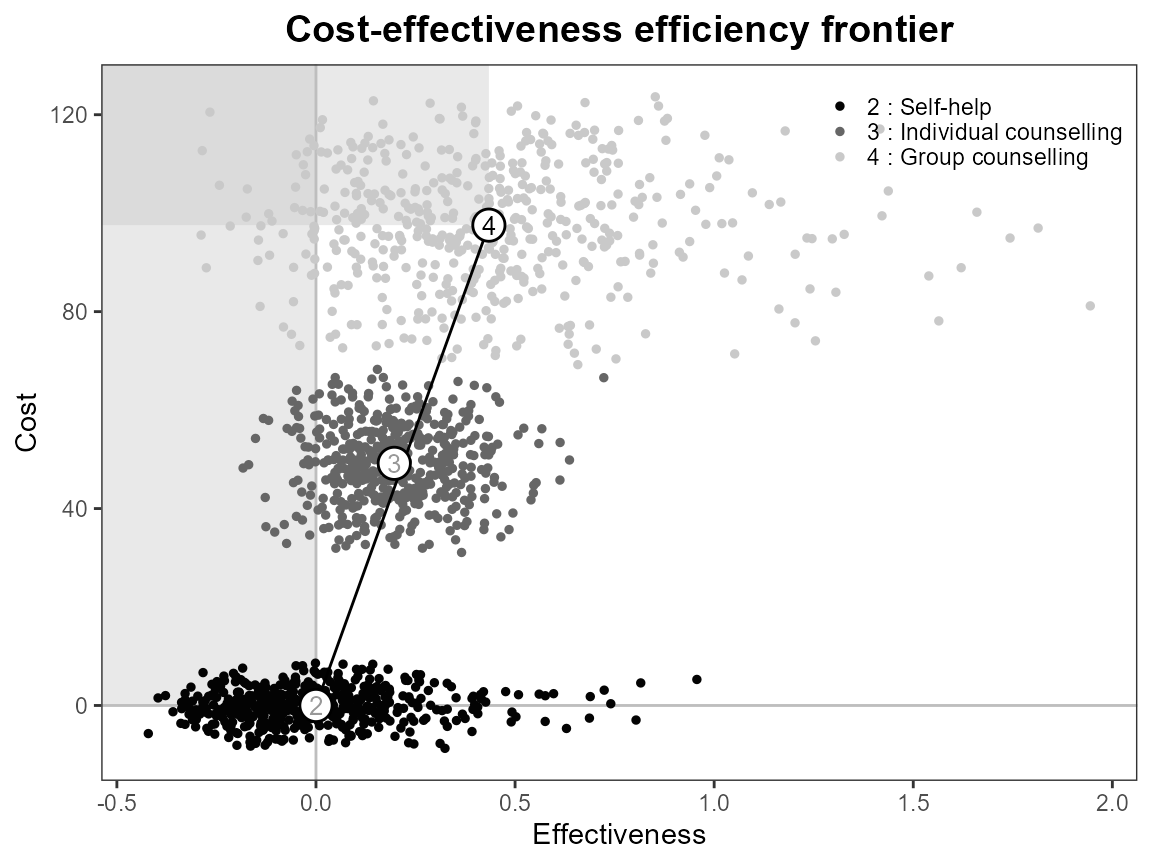
setComparisons(bcea_smoke) <- 1
ceef.plot(bcea_smoke, graph = "ggplot")
#>
#> Cost-effectiveness efficiency frontier summary
#>
#> Interventions on the efficiency frontier:
#>           Effectiveness Costs Increase slope Increase angle
#> Self-help       0.72252 143.3         198.33         1.5658
#>
#> Interventions not on the efficiency frontier:
#>                 Effectiveness Costs     Dominance type
#> No intervention             0     0 Extended dominance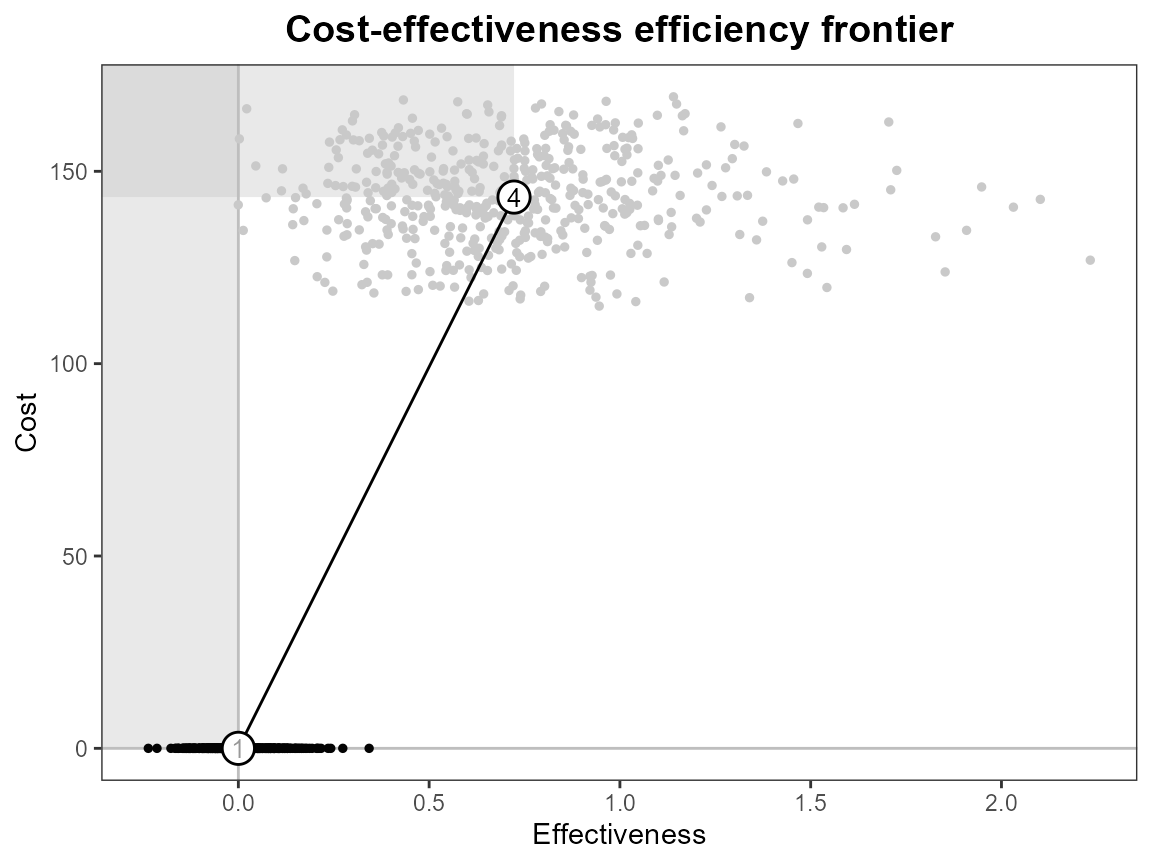
# add interventions back in
setComparisons(bcea_smoke) <- c(1,3)
ceef.plot(bcea_smoke, graph = "ggplot")
#>
#> Cost-effectiveness efficiency frontier summary
#>
#> Interventions on the efficiency frontier:
#>                        Effectiveness   Costs Increase slope Increase angle
#> Self-help                    0.48486  94.919         195.77         1.5657
#> Individual counselling       0.72252 143.301         203.57         1.5659
#>
#> Interventions not on the efficiency frontier:
#>                 Effectiveness Costs     Dominance type
#> No intervention             0     0 Extended dominance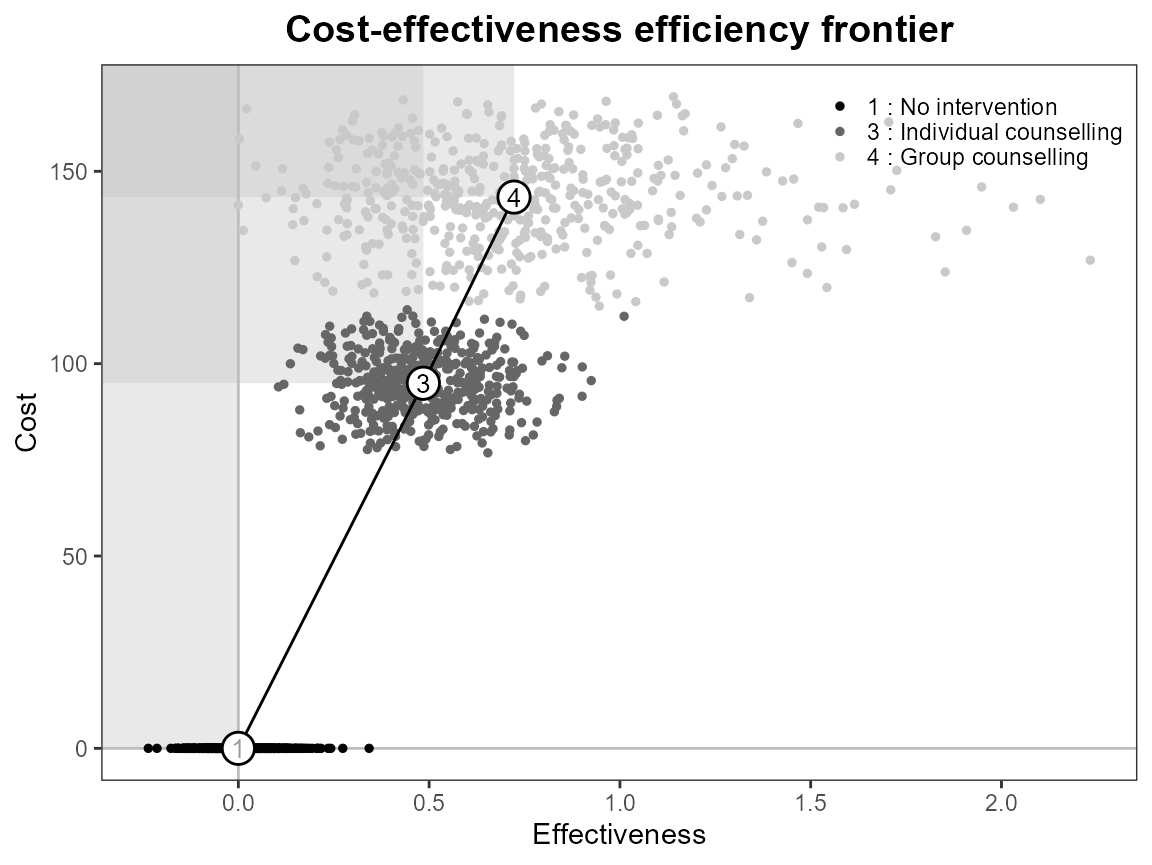
Check legend position argument:
# base R
ceef.plot(bcea_smoke, pos = c(1,0))
#>
#> Cost-effectiveness efficiency frontier summary
#>
#> Interventions on the efficiency frontier:
#>                        Effectiveness   Costs Increase slope Increase angle
#> Self-help                    0.48486  94.919         195.77         1.5657
#> Individual counselling       0.72252 143.301         203.57         1.5659
#>
#> Interventions not on the efficiency frontier:
#>                 Effectiveness Costs     Dominance type
#> No intervention             0     0 Extended dominance
ceef.plot(bcea_smoke, pos = c(1,1))
#>
#> Cost-effectiveness efficiency frontier summary
#>
#> Interventions on the efficiency frontier:
#>                        Effectiveness   Costs Increase slope Increase angle
#> Self-help                    0.48486  94.919         195.77         1.5657
#> Individual counselling       0.72252 143.301         203.57         1.5659
#>
#> Interventions not on the efficiency frontier:
#>                 Effectiveness Costs     Dominance type
#> No intervention             0     0 Extended dominance
ceef.plot(bcea_smoke, pos = TRUE)
#>
#> Cost-effectiveness efficiency frontier summary
#>
#> Interventions on the efficiency frontier:
#>                        Effectiveness   Costs Increase slope Increase angle
#> Self-help                    0.48486  94.919         195.77         1.5657
#> Individual counselling       0.72252 143.301         203.57         1.5659
#>
#> Interventions not on the efficiency frontier:
#>                 Effectiveness Costs     Dominance type
#> No intervention             0     0 Extended dominance
ceef.plot(bcea_smoke, pos = FALSE)
#>
#> Cost-effectiveness efficiency frontier summary
#>
#> Interventions on the efficiency frontier:
#>                        Effectiveness   Costs Increase slope Increase angle
#> Self-help                    0.48486  94.919         195.77         1.5657
#> Individual counselling       0.72252 143.301         203.57         1.5659
#>
#> Interventions not on the efficiency frontier:
#>                 Effectiveness Costs     Dominance type
#> No intervention             0     0 Extended dominance
ceef.plot(bcea_smoke, pos = "topleft")
#>
#> Cost-effectiveness efficiency frontier summary
#>
#> Interventions on the efficiency frontier:
#>                        Effectiveness   Costs Increase slope Increase angle
#> Self-help                    0.48486  94.919         195.77         1.5657
#> Individual counselling       0.72252 143.301         203.57         1.5659
#>
#> Interventions not on the efficiency frontier:
#>                 Effectiveness Costs     Dominance type
#> No intervention             0     0 Extended dominance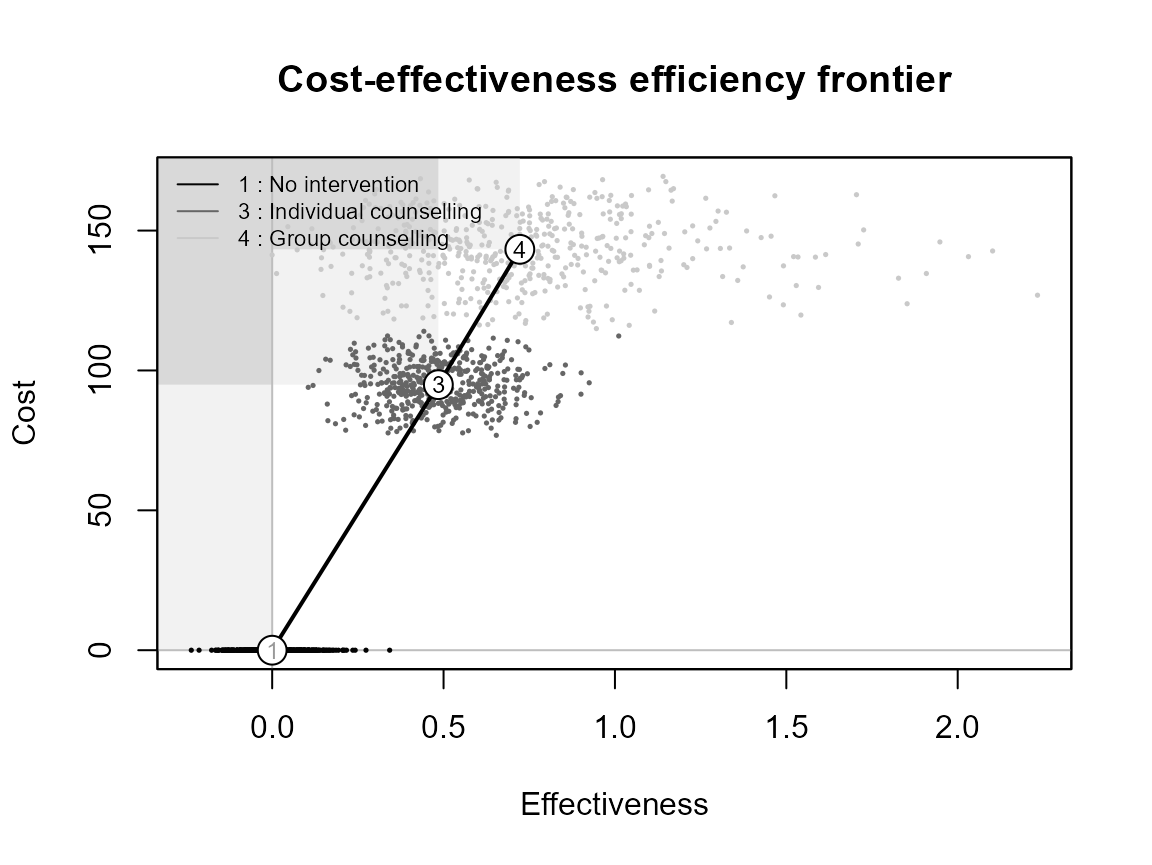
ceef.plot(bcea_smoke, pos = "topright")
#>
#> Cost-effectiveness efficiency frontier summary
#>
#> Interventions on the efficiency frontier:
#>                        Effectiveness   Costs Increase slope Increase angle
#> Self-help                    0.48486  94.919         195.77         1.5657
#> Individual counselling       0.72252 143.301         203.57         1.5659
#>
#> Interventions not on the efficiency frontier:
#>                 Effectiveness Costs     Dominance type
#> No intervention             0     0 Extended dominance
ceef.plot(bcea_smoke, pos = "bottomleft")
#>
#> Cost-effectiveness efficiency frontier summary
#>
#> Interventions on the efficiency frontier:
#>                        Effectiveness   Costs Increase slope Increase angle
#> Self-help                    0.48486  94.919         195.77         1.5657
#> Individual counselling       0.72252 143.301         203.57         1.5659
#>
#> Interventions not on the efficiency frontier:
#>                 Effectiveness Costs     Dominance type
#> No intervention             0     0 Extended dominance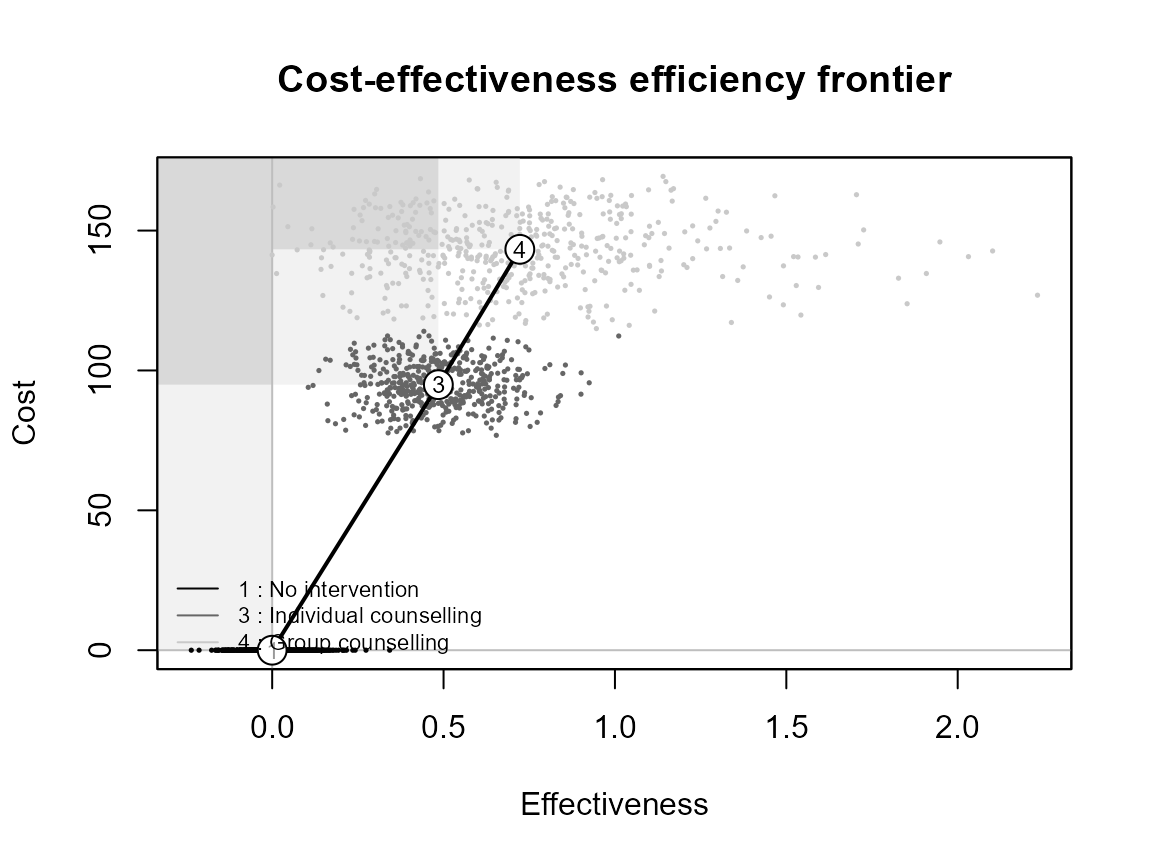
ceef.plot(bcea_smoke, pos = "bottomright")
#>
#> Cost-effectiveness efficiency frontier summary
#>
#> Interventions on the efficiency frontier:
#>                        Effectiveness   Costs Increase slope Increase angle
#> Self-help                    0.48486  94.919         195.77         1.5657
#> Individual counselling       0.72252 143.301         203.57         1.5659
#>
#> Interventions not on the efficiency frontier:
#>                 Effectiveness Costs     Dominance type
#> No intervention             0     0 Extended dominance
# ggplot2
ceef.plot(bcea_smoke, graph = "ggplot", pos = c(1,0))
#>
#> Cost-effectiveness efficiency frontier summary
#>
#> Interventions on the efficiency frontier:
#>                        Effectiveness   Costs Increase slope Increase angle
#> Self-help                    0.48486  94.919         195.77         1.5657
#> Individual counselling       0.72252 143.301         203.57         1.5659
#>
#> Interventions not on the efficiency frontier:
#>                 Effectiveness Costs     Dominance type
#> No intervention             0     0 Extended dominance
ceef.plot(bcea_smoke, graph = "ggplot", pos = c(1,1))
#>
#> Cost-effectiveness efficiency frontier summary
#>
#> Interventions on the efficiency frontier:
#>                        Effectiveness   Costs Increase slope Increase angle
#> Self-help                    0.48486  94.919         195.77         1.5657
#> Individual counselling       0.72252 143.301         203.57         1.5659
#>
#> Interventions not on the efficiency frontier:
#>                 Effectiveness Costs     Dominance type
#> No intervention             0     0 Extended dominance
ceef.plot(bcea_smoke, graph = "ggplot", pos = TRUE)
#>
#> Cost-effectiveness efficiency frontier summary
#>
#> Interventions on the efficiency frontier:
#>                        Effectiveness   Costs Increase slope Increase angle
#> Self-help                    0.48486  94.919         195.77         1.5657
#> Individual counselling       0.72252 143.301         203.57         1.5659
#>
#> Interventions not on the efficiency frontier:
#>                 Effectiveness Costs     Dominance type
#> No intervention             0     0 Extended dominance
ceef.plot(bcea_smoke, graph = "ggplot", pos = FALSE)
#>
#> Cost-effectiveness efficiency frontier summary
#>
#> Interventions on the efficiency frontier:
#>                        Effectiveness   Costs Increase slope Increase angle
#> Self-help                    0.48486  94.919         195.77         1.5657
#> Individual counselling       0.72252 143.301         203.57         1.5659
#>
#> Interventions not on the efficiency frontier:
#>                 Effectiveness Costs     Dominance type
#> No intervention             0     0 Extended dominance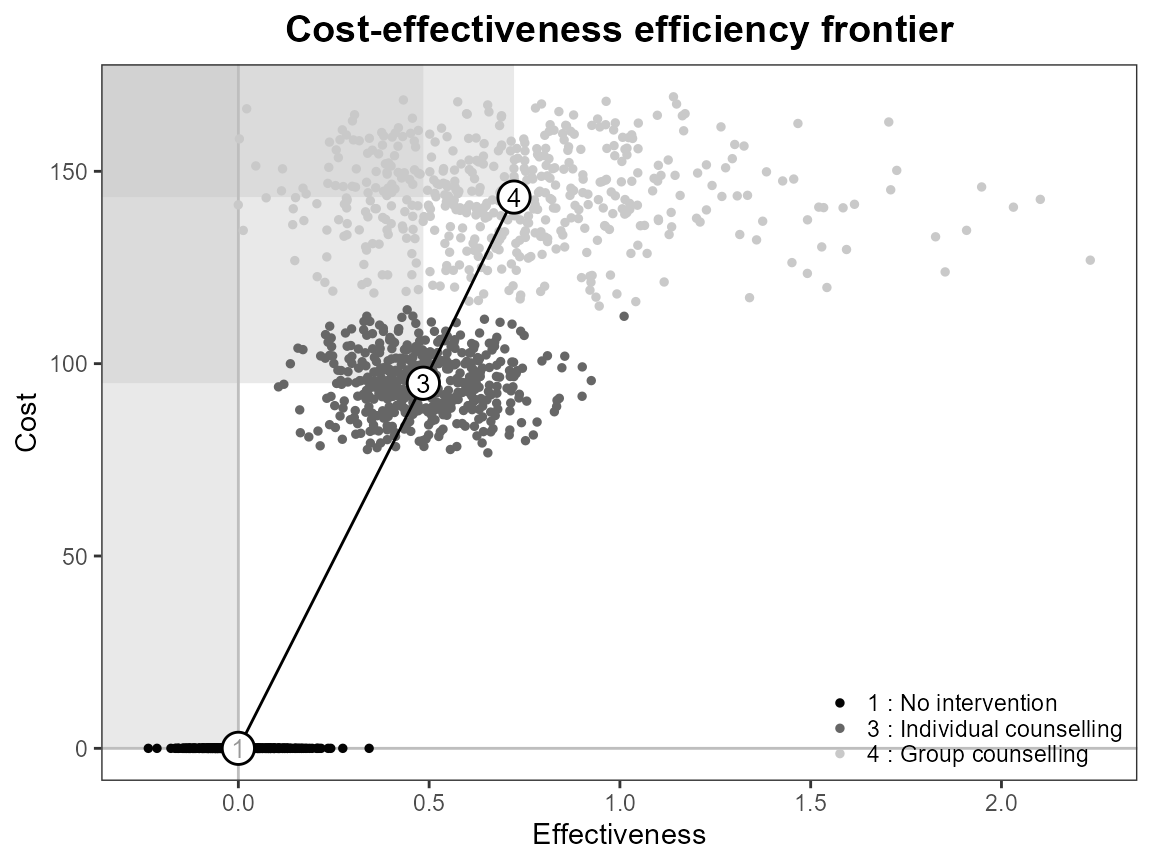
ceef.plot(bcea_smoke, graph = "ggplot", pos = "top")
#>
#> Cost-effectiveness efficiency frontier summary
#>
#> Interventions on the efficiency frontier:
#>                        Effectiveness   Costs Increase slope Increase angle
#> Self-help                    0.48486  94.919         195.77         1.5657
#> Individual counselling       0.72252 143.301         203.57         1.5659
#>
#> Interventions not on the efficiency frontier:
#>                 Effectiveness Costs     Dominance type
#> No intervention             0     0 Extended dominance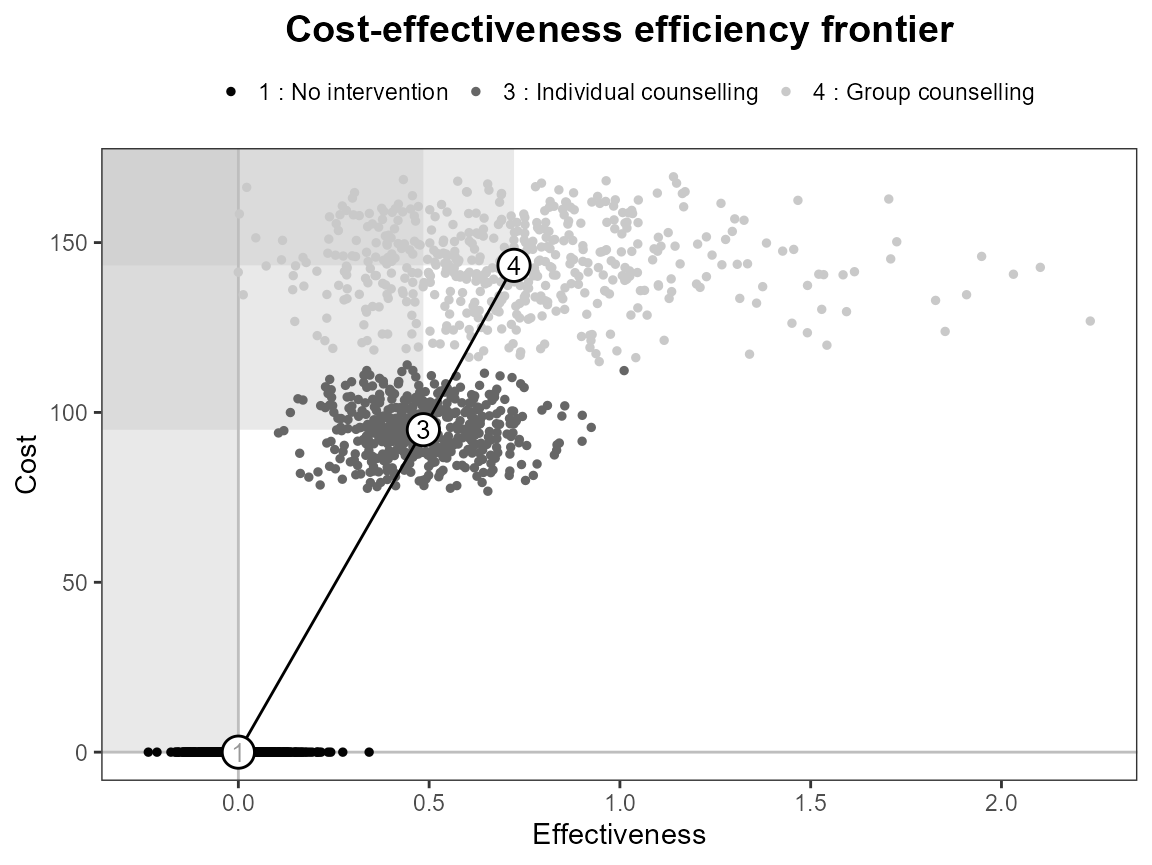
ceef.plot(bcea_smoke, graph = "ggplot", pos = "bottom")
#>
#> Cost-effectiveness efficiency frontier summary
#>
#> Interventions on the efficiency frontier:
#>                        Effectiveness   Costs Increase slope Increase angle
#> Self-help                    0.48486  94.919         195.77         1.5657
#> Individual counselling       0.72252 143.301         203.57         1.5659
#>
#> Interventions not on the efficiency frontier:
#>                 Effectiveness Costs     Dominance type
#> No intervention             0     0 Extended dominance
ceef.plot(bcea_smoke, graph = "ggplot", pos = "left")
#>
#> Cost-effectiveness efficiency frontier summary
#>
#> Interventions on the efficiency frontier:
#>                        Effectiveness   Costs Increase slope Increase angle
#> Self-help                    0.48486  94.919         195.77         1.5657
#> Individual counselling       0.72252 143.301         203.57         1.5659
#>
#> Interventions not on the efficiency frontier:
#>                 Effectiveness Costs     Dominance type
#> No intervention             0     0 Extended dominance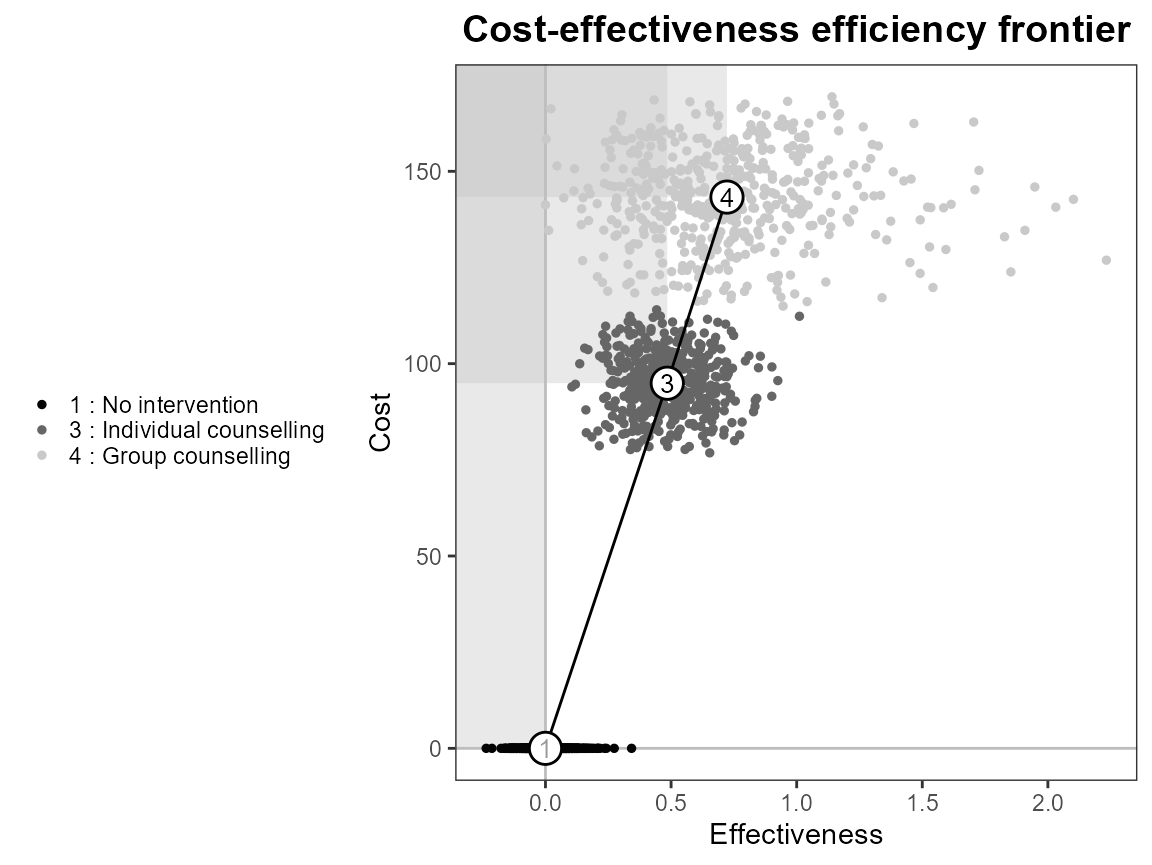
ceef.plot(bcea_smoke, graph = "ggplot", pos = "right")
#>
#> Cost-effectiveness efficiency frontier summary
#>
#> Interventions on the efficiency frontier:
#>                        Effectiveness   Costs Increase slope Increase angle
#> Self-help                    0.48486  94.919         195.77         1.5657
#> Individual counselling       0.72252 143.301         203.57         1.5659
#>
#> Interventions not on the efficiency frontier:
#>                 Effectiveness Costs     Dominance type
#> No intervention             0     0 Extended dominance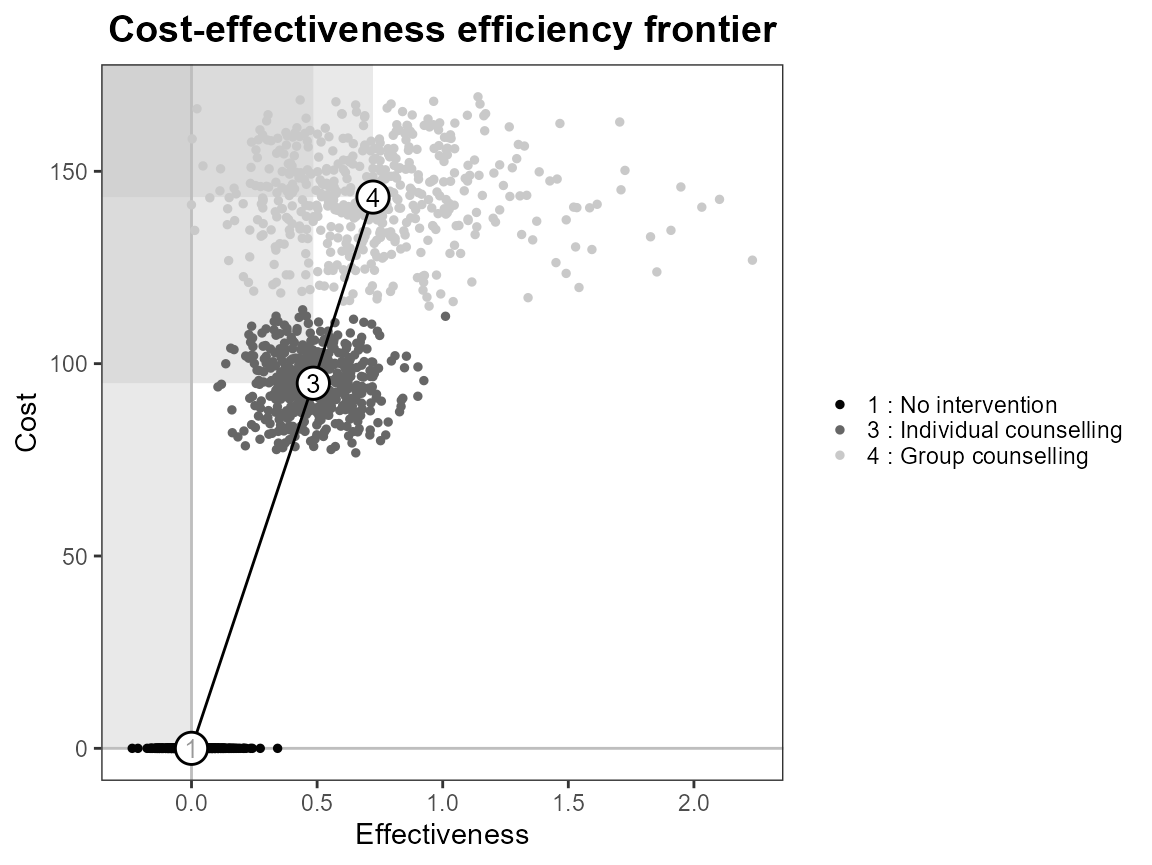
Flipping plot
ceef.plot(bcea_smoke,
          flip = TRUE,
          dominance = FALSE,
          start.from.origins = FALSE,
          print.summary = FALSE,
          graph = "base")
ceef.plot(bcea_smoke,
          dominance = TRUE,
          start.from.origins = FALSE,
          pos = TRUE,
          print.summary = FALSE,
          graph = "ggplot2")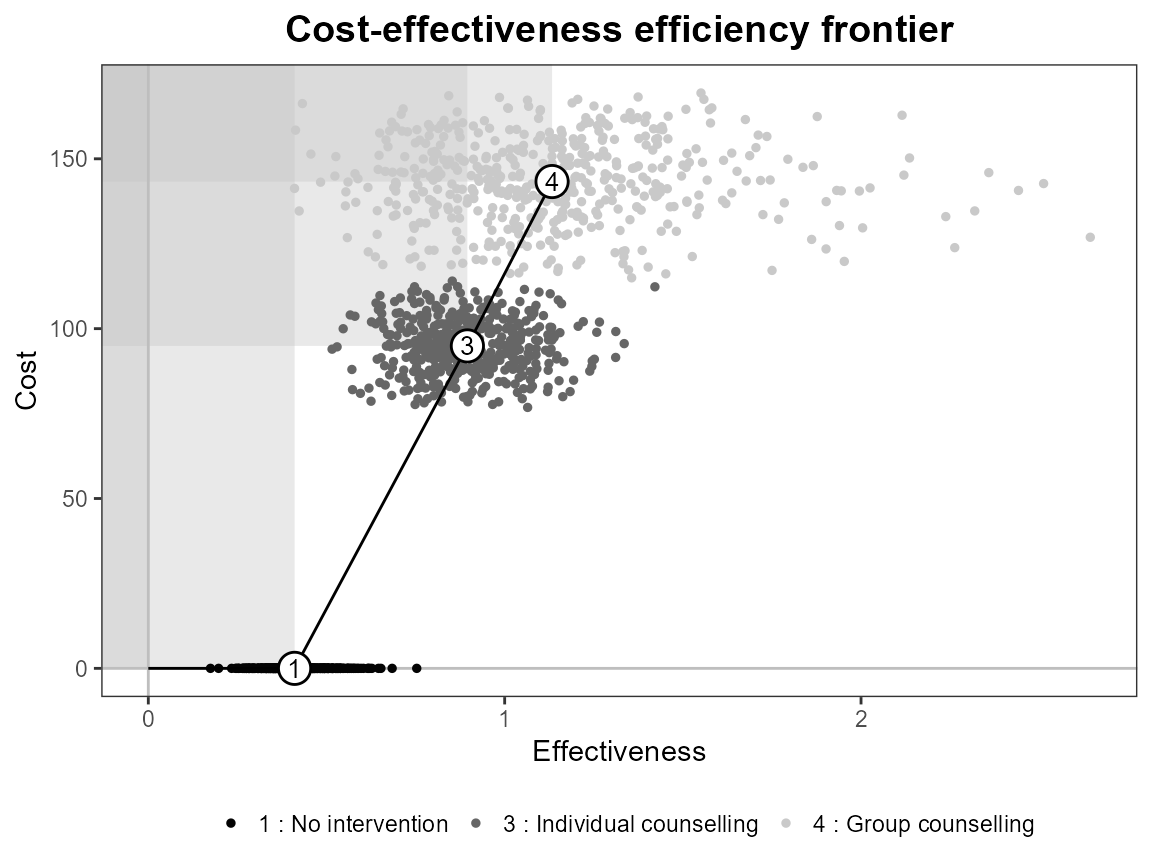
Start from origin or smallest (e,c).
ceef.plot(bcea_smoke,
          flip = TRUE,
          dominance = TRUE,
          start.from.origins = TRUE,
          print.summary = FALSE,
          graph = "base")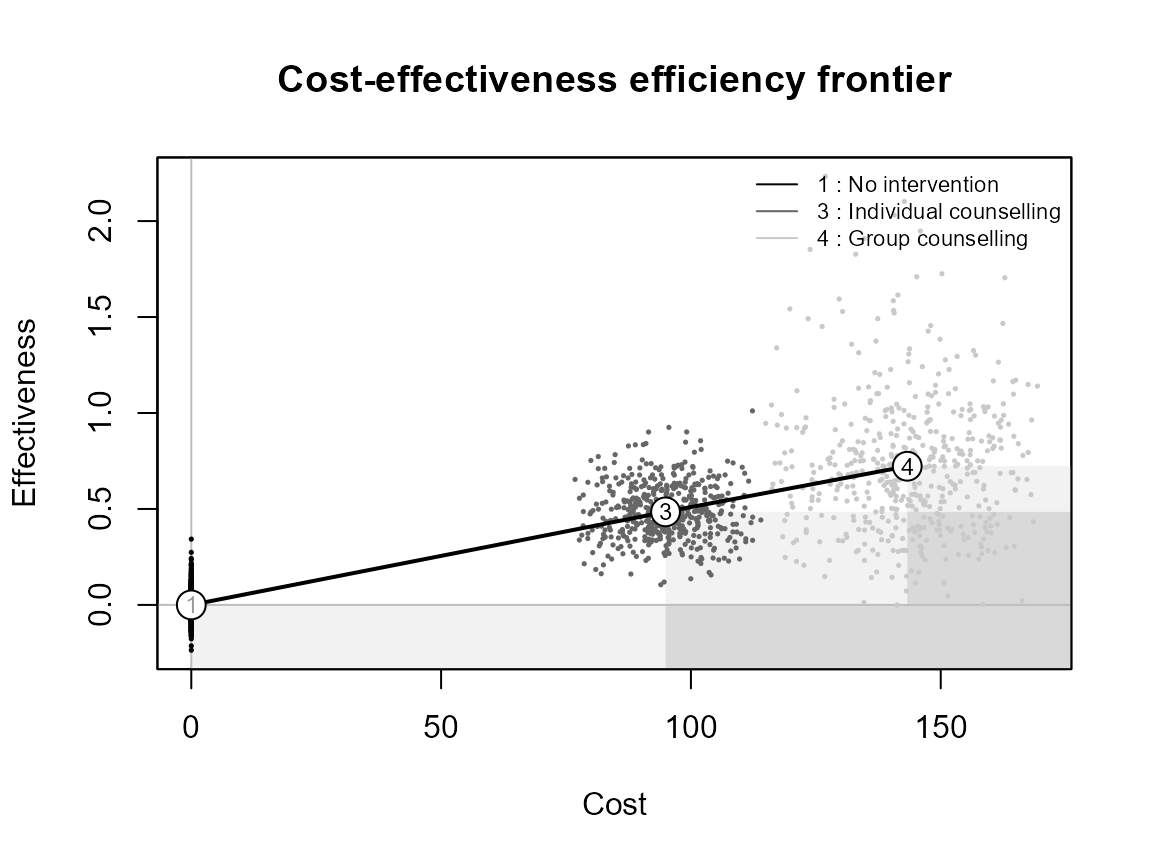
ceef.plot(bcea_smoke,
          dominance = TRUE,
          start.from.origins = TRUE,
          pos = TRUE,
          print.summary = FALSE,
          graph = "ggplot2")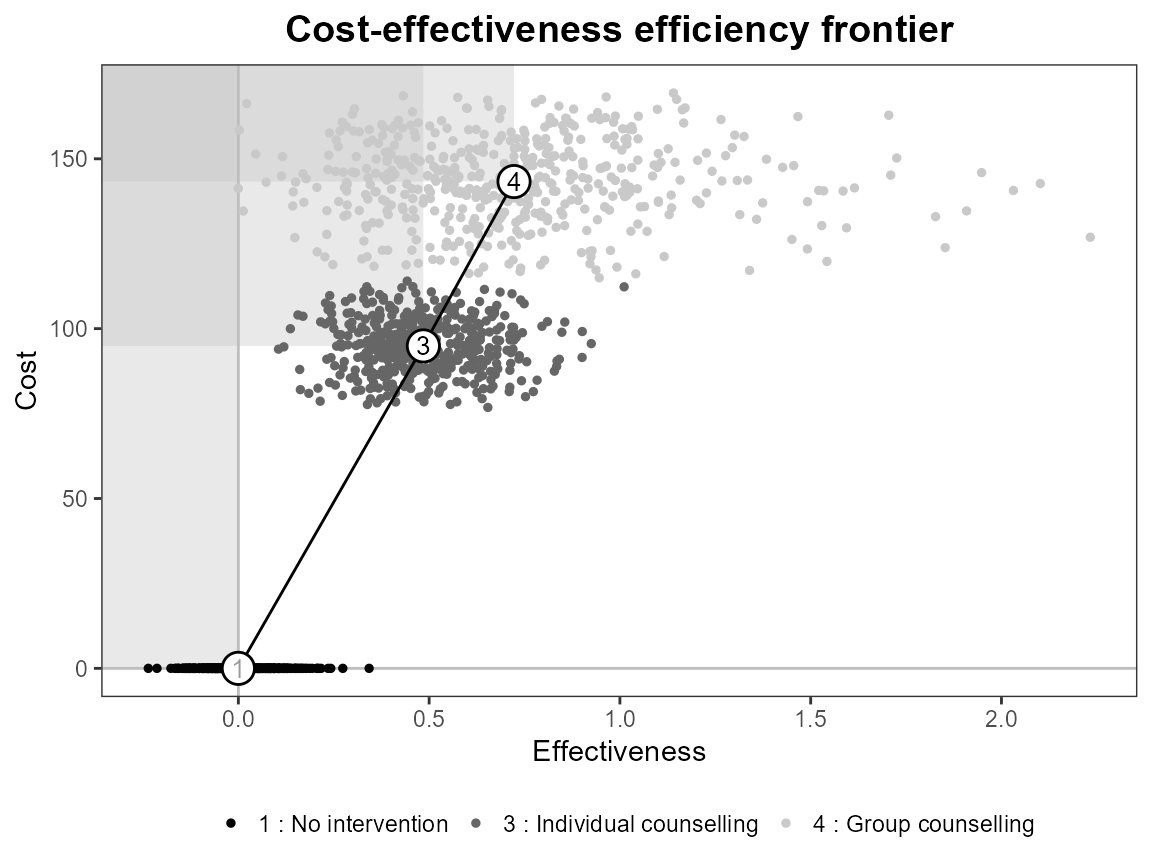
Negative cost or effectiveness
data("Smoking")

cost[, 4] <- -cost[, 4]
bcea_smoke <- bcea(eff, cost, ref = 3, interventions = treats, Kmax = 500)

# all interventions
ceef.plot(bcea_smoke, graph = "ggplot")
#> Costs are negative, the frontier will not start from the origins
#>
#> Cost-effectiveness efficiency frontier summary
#>
#> Interventions on the efficiency frontier:
#>                   Effectiveness  Costs Increase slope Increase angle
#> Group counselling         1.133 -143.3             NA             NA
#>
#> Interventions not on the efficiency frontier:
#>                        Effectiveness    Costs     Dominance type
#> No treatment                 0.41051    0.000 Absolute dominance
#> Self-help                    0.69875   45.733 Absolute dominance
#> Individual counselling       1.13303 -143.301 Extended dominance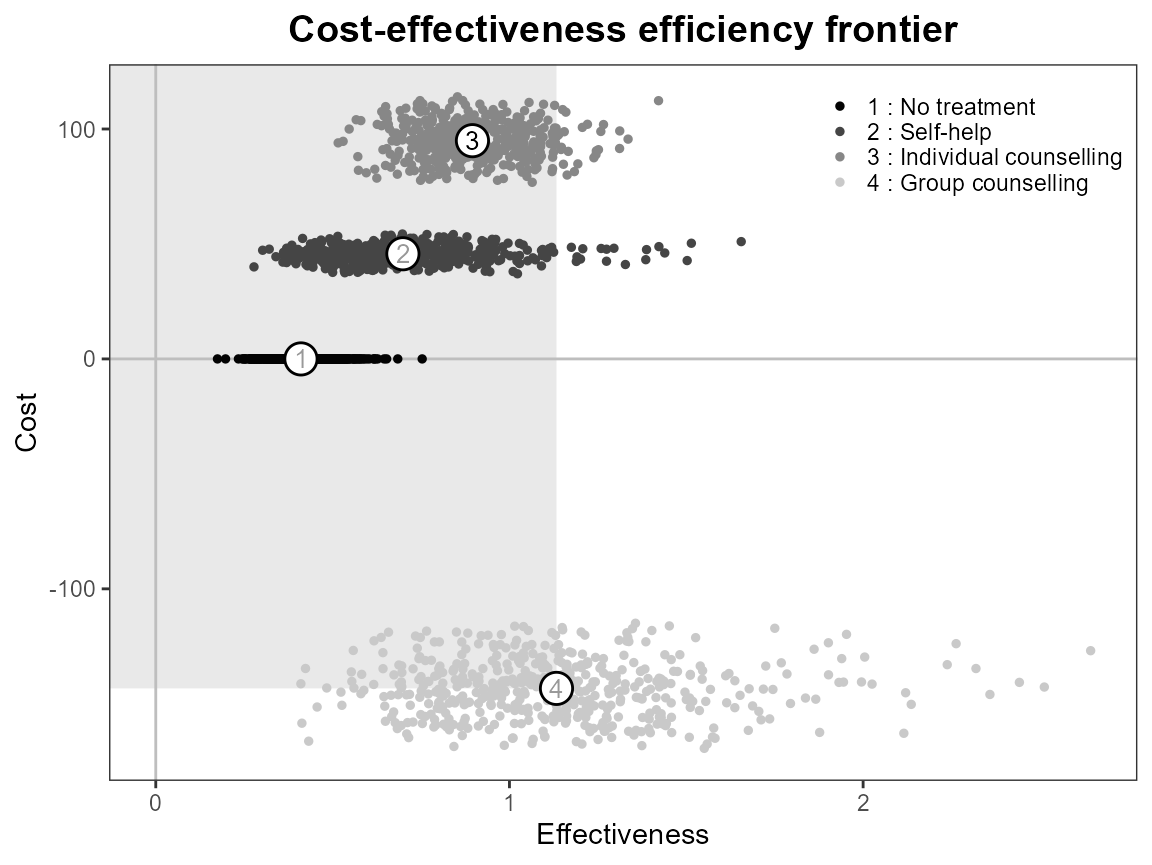
ceef.plot(bcea_smoke, graph = "base")
#> Costs are negative, the frontier will not start from the origins
#>
#> Cost-effectiveness efficiency frontier summary
#>
#> Interventions on the efficiency frontier:
#>                   Effectiveness  Costs Increase slope Increase angle
#> Group counselling         1.133 -143.3             NA             NA
#>
#> Interventions not on the efficiency frontier:
#>                        Effectiveness    Costs     Dominance type
#> No treatment                 0.41051    0.000 Absolute dominance
#> Self-help                    0.69875   45.733 Absolute dominance
#> Individual counselling       1.13303 -143.301 Extended dominance
ceef.plot(bcea_smoke, start.from.origins = TRUE, graph = "ggplot")
#> Costs are negative, the frontier will not start from the origins
#>
#> Cost-effectiveness efficiency frontier summary
#>
#> Interventions on the efficiency frontier:
#>                   Effectiveness  Costs Increase slope Increase angle
#> Group counselling         1.133 -143.3             NA             NA
#>
#> Interventions not on the efficiency frontier:
#>                        Effectiveness    Costs     Dominance type
#> No treatment                 0.41051    0.000 Absolute dominance
#> Self-help                    0.69875   45.733 Absolute dominance
#> Individual counselling       1.13303 -143.301 Extended dominance
ceef.plot(bcea_smoke, start.from.origins = TRUE, graph = "base")
#> Costs are negative, the frontier will not start from the origins
#>
#> Cost-effectiveness efficiency frontier summary
#>
#> Interventions on the efficiency frontier:
#>                   Effectiveness  Costs Increase slope Increase angle
#> Group counselling         1.133 -143.3             NA             NA
#>
#> Interventions not on the efficiency frontier:
#>                        Effectiveness    Costs     Dominance type
#> No treatment                 0.41051    0.000 Absolute dominance
#> Self-help                    0.69875   45.733 Absolute dominance
#> Individual counselling       1.13303 -143.301 Extended dominance
setComparisons(bcea_smoke) <- c(1,2)
ceef.plot(bcea_smoke, graph = "ggplot")
#>
#> Cost-effectiveness efficiency frontier summary
#>
#> Interventions on the efficiency frontier:
#>                        Effectiveness  Costs Increase slope Increase angle
#> Self-help                    0.28824 45.733         158.66         1.5645
#> Individual counselling       0.48486 94.919         250.16         1.5668
#>
#> Interventions not on the efficiency frontier:
#>              Effectiveness Costs     Dominance type
#> No treatment             0     0 Extended dominance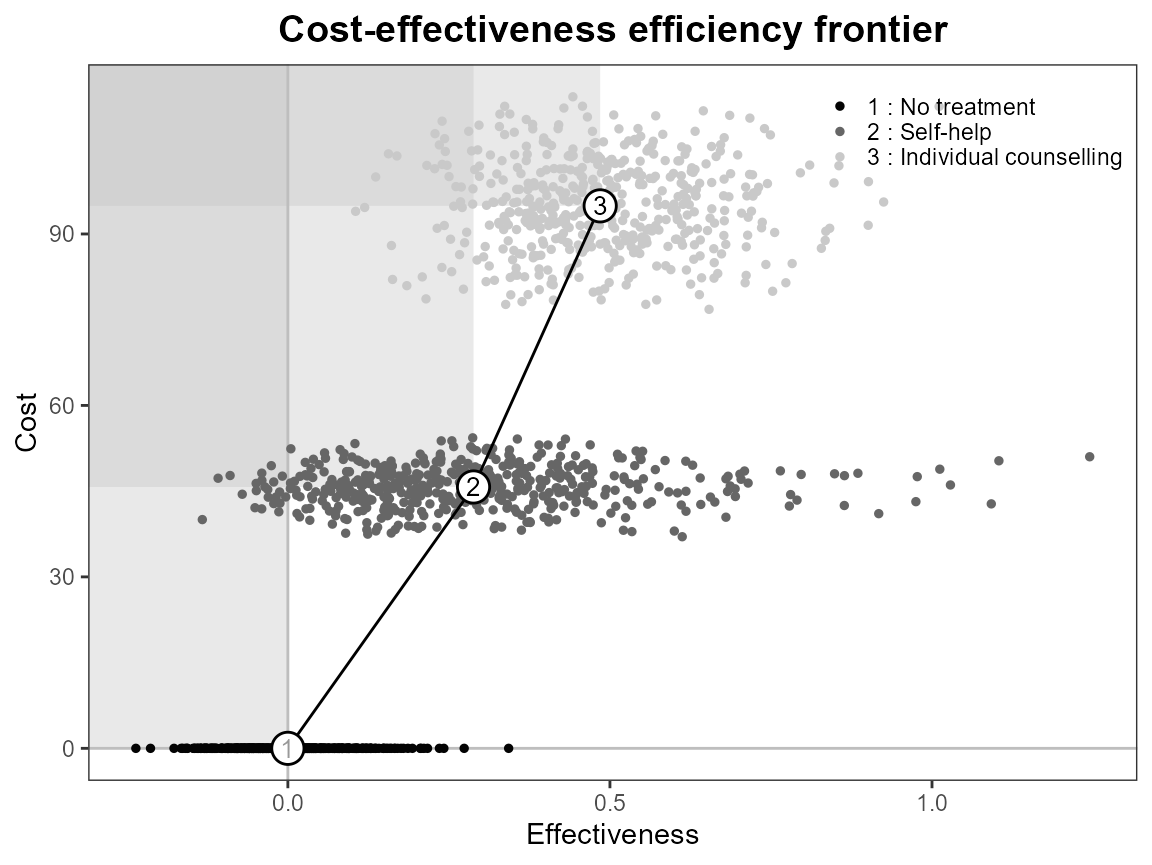
ceef.plot(bcea_smoke, graph = "base")
#>
#> Cost-effectiveness efficiency frontier summary
#>
#> Interventions on the efficiency frontier:
#>                        Effectiveness  Costs Increase slope Increase angle
#> Self-help                    0.28824 45.733         158.66         1.5645
#> Individual counselling       0.48486 94.919         250.16         1.5668
#>
#> Interventions not on the efficiency frontier:
#>              Effectiveness Costs     Dominance type
#> No treatment             0     0 Extended dominance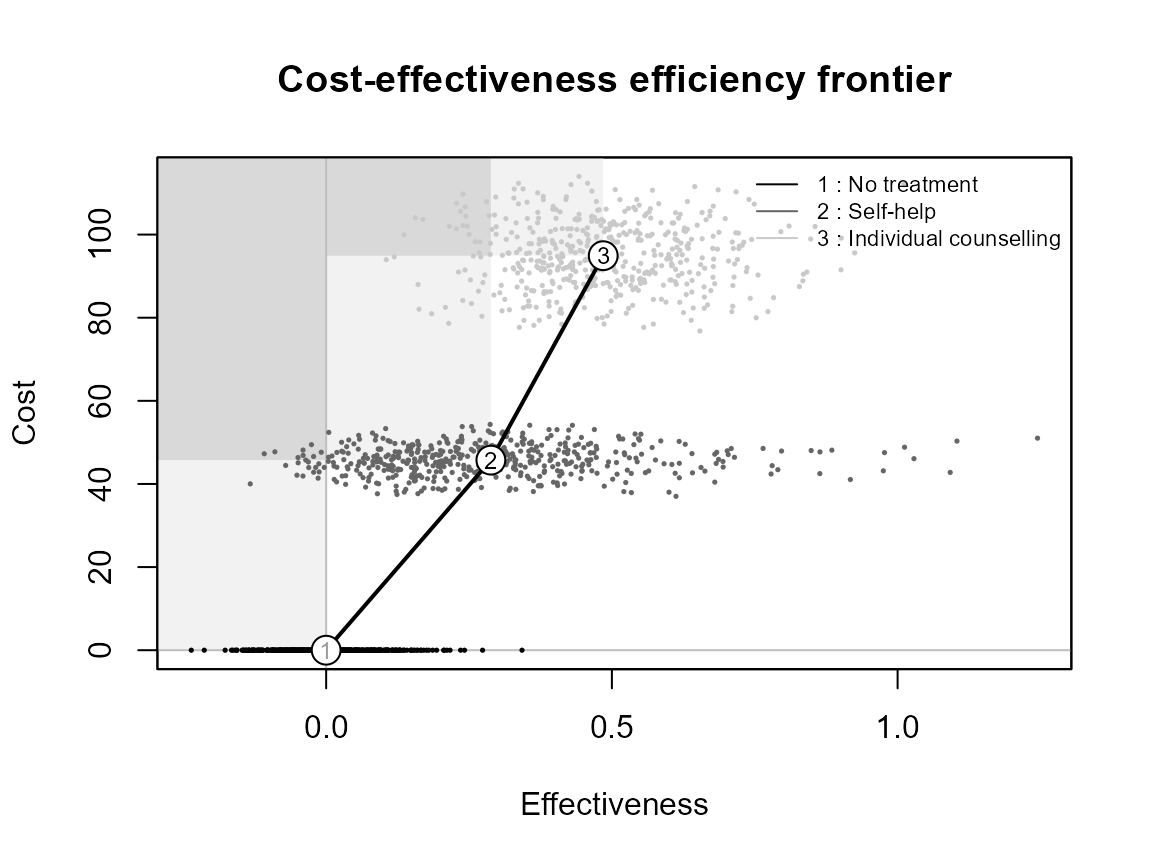
eff[, 3] <- -eff[, 3]
bcea_smoke <- bcea(eff, cost, ref = 3, interventions = treats, Kmax = 500)
ceef.plot(bcea_smoke, graph = "ggplot")
#> Costs and benefits are negative, the frontier will not start from the origins
#>
#> Cost-effectiveness efficiency frontier summary
#>
#> Interventions on the efficiency frontier:
#>                   Effectiveness  Costs Increase slope Increase angle
#> Group counselling         1.133 -143.3             NA             NA
#>
#> Interventions not on the efficiency frontier:
#>                        Effectiveness    Costs     Dominance type
#> No treatment                 0.41051    0.000 Absolute dominance
#> Self-help                    0.69875   45.733 Absolute dominance
#> Individual counselling       1.13303 -143.301 Extended dominance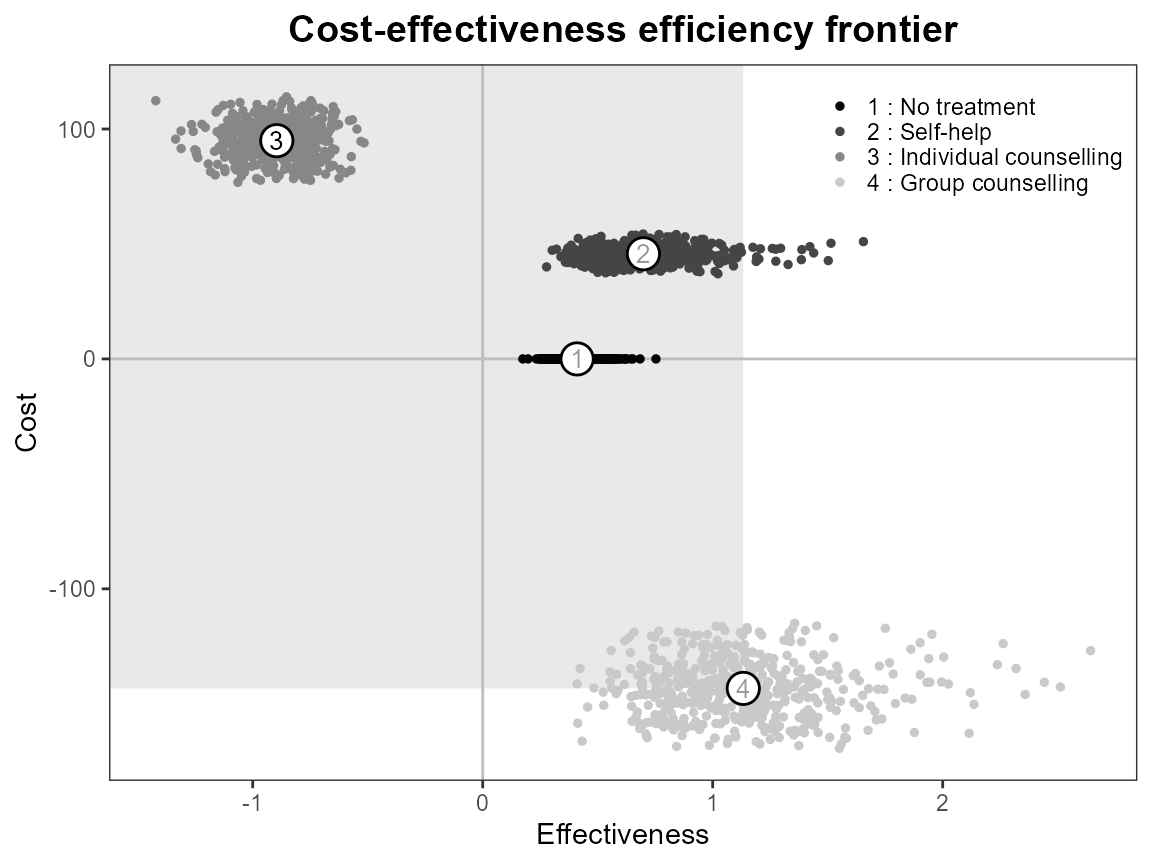
ceef.plot(bcea_smoke, graph = "base")
#> Costs and benefits are negative, the frontier will not start from the origins
#>
#> Cost-effectiveness efficiency frontier summary
#>
#> Interventions on the efficiency frontier:
#>                   Effectiveness  Costs Increase slope Increase angle
#> Group counselling         1.133 -143.3             NA             NA
#>
#> Interventions not on the efficiency frontier:
#>                        Effectiveness    Costs     Dominance type
#> No treatment                 0.41051    0.000 Absolute dominance
#> Self-help                    0.69875   45.733 Absolute dominance
#> Individual counselling       1.13303 -143.301 Extended dominance
data("Smoking")
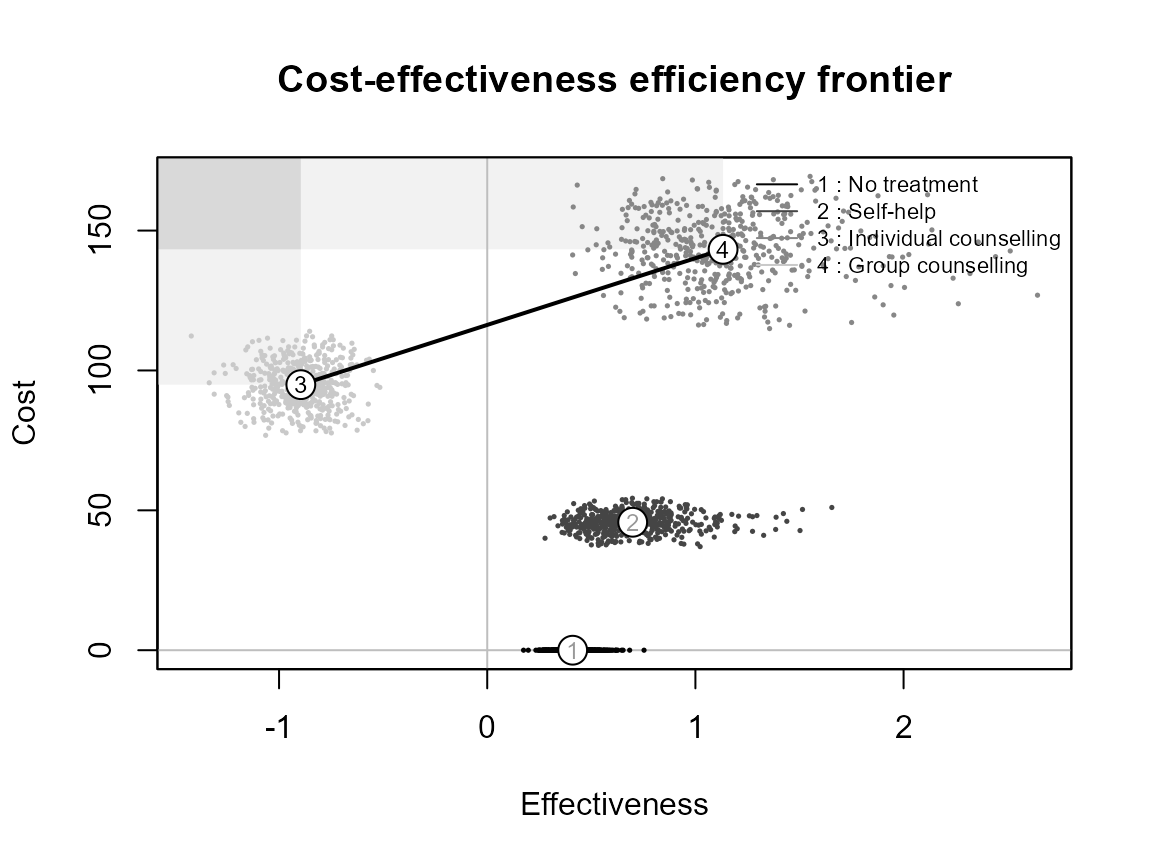
eff[, 3] <- -eff[, 3]
bcea_smoke <- bcea(eff, cost, ref = 3, interventions = treats, Kmax = 500)
ceef.plot(bcea_smoke, graph = "ggplot")
#> Benefits are negative, the frontier will not start from the origins
#>
#> Cost-effectiveness efficiency frontier summary
#>
#> Interventions on the efficiency frontier:
#> Effectiveness Costs Increase slope Increase angle
#> Individual counselling -0.89536 94.919 NA NA
#> Group counselling 1.13303 143.301 23.852 1.5289
#>
#> Interventions not on the efficiency frontier:
#> Effectiveness Costs Dominance type
#> No treatment 0.41051 0.000 Absolute dominance
#> Self-help 0.69875 45.733 Absolute dominance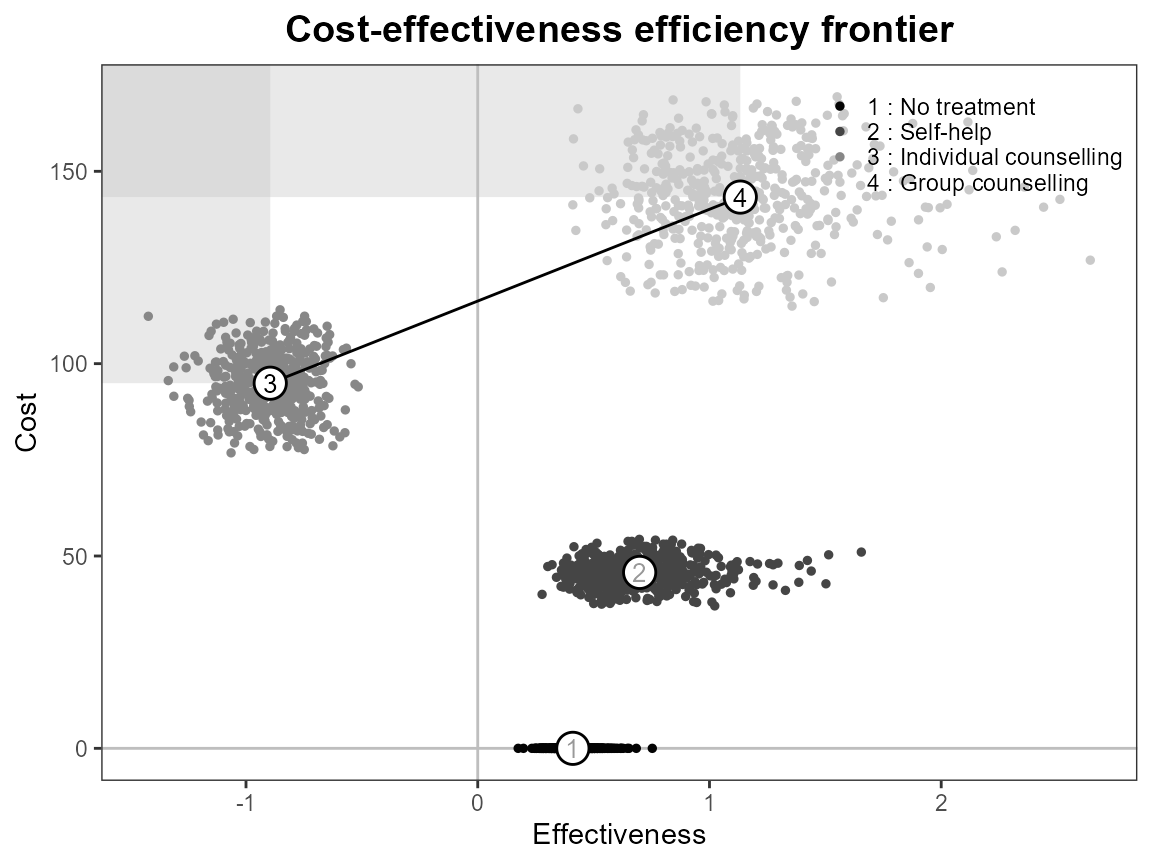
ceef.plot(bcea_smoke, graph = "base")
#> Benefits are negative, the frontier will not start from the origins
#>
#> Cost-effectiveness efficiency frontier summary
#>
#> Interventions on the efficiency frontier:
#>                        Effectiveness   Costs Increase slope Increase angle
#> Individual counselling      -0.89536  94.919             NA             NA
#> Group counselling            1.13303 143.301         23.852         1.5289
#>
#> Interventions not on the efficiency frontier:
#>              Effectiveness  Costs     Dominance type
#> No treatment       0.41051  0.000 Absolute dominance
#> Self-help          0.69875 45.733 Absolute dominance