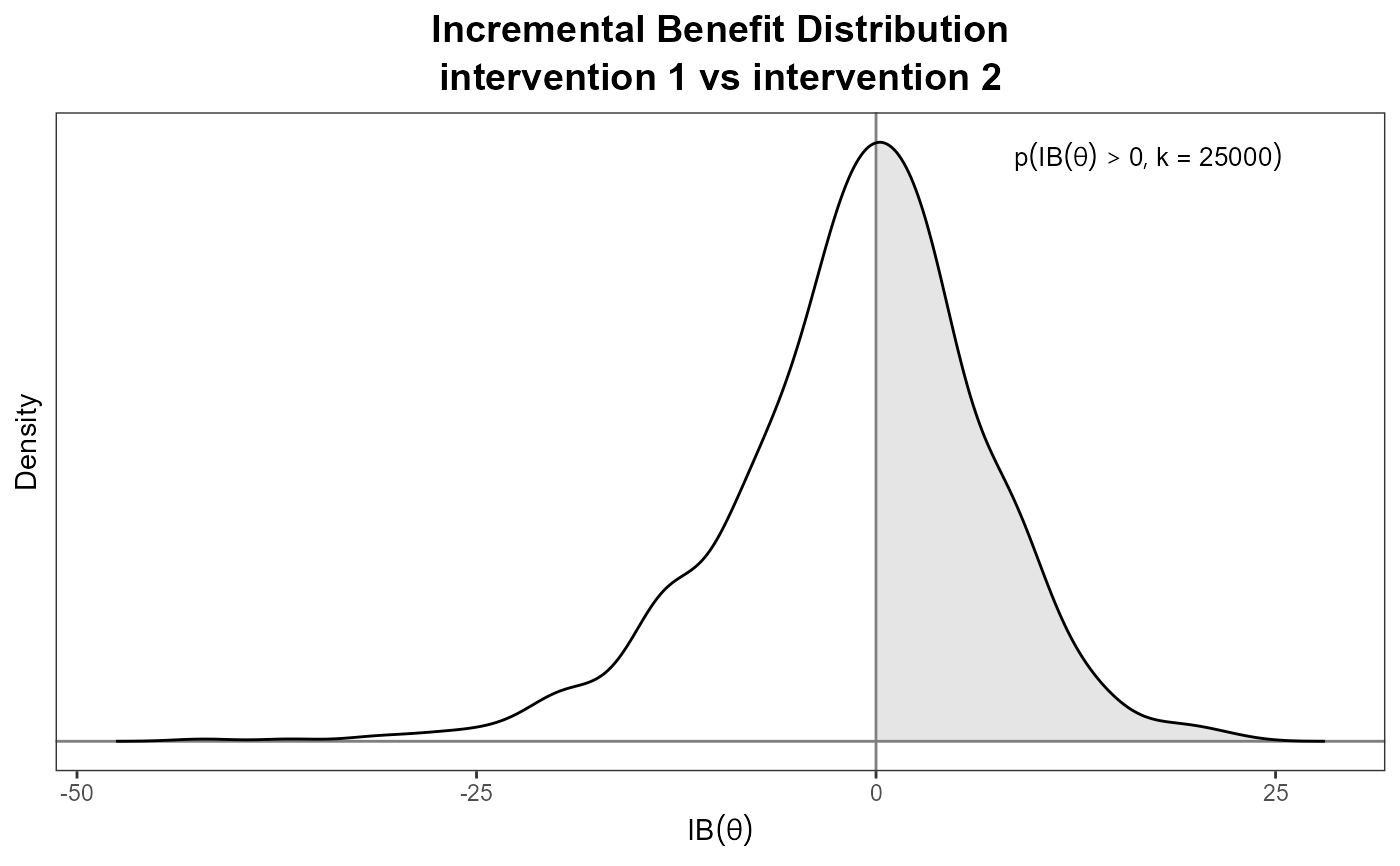
Plots the distribution of the Incremental Benefit (IB) for a given value of the willingness to pay threshold.
Usage
# S3 method for bcea
ib.plot(
  he,
  comparison = NULL,
  wtp = 25000,
  bw = "bcv",
  n = 512,
  xlim = NULL,
  graph = c("base", "ggplot2"),
  ...
)

ib.plot(he, ...)
Arguments
- he
A
bceaobject containing the results of the Bayesian modelling and the economic evaluation.- comparison
In the case of multiple interventions, specifies the one to be used in comparison with the reference. Default value of
NULLforces R to consider the first non-reference intervention as the comparator. Controls which comparator is used when more than 2 interventions are present- wtp
The value of the willingness to pay threshold. Default value at
25000.- bw
Identifies the smoothing bandwidth used to construct the kernel estimation of the IB density.
- n
The number of equally spaced points at which the density is to be estimated.
- xlim
The limits of the plot on the x-axis.
- graph
A string used to select the graphical engine to use for plotting. Should (partial-) match the two options
"base"or"ggplot2". Default value is"base".- ...
Additional arguments
Value
- ib
A ggplot object containing the requested plot. Returned only if
graph="ggplot2".
The function produces a plot of the distribution of the Incremental Benefit for a given value of the willingness to pay parameter. The dashed area indicates the positive part of the distribution (i.e. when the reference is more cost-effective than the comparator).
References
Baio G, Dawid aP (2011). “Probabilistic sensitivity analysis in health economics.” Stat. Methods Med. Res., 1--20. ISSN 1477-0334, doi:10.1177/0962280211419832 , https://pubmed.ncbi.nlm.nih.gov/21930515/.
Baio G (2013). Bayesian Methods in Health Economics. CRC.