Choice of base R, ggplot2 or plotly.
Usage
# S3 method for bcea
ceplane_plot_base(he, wtp = 25000, pos_legend, graph_params, ...)

ceplane_plot_base(he, ...)

# S3 method for bcea
ceplane_plot_ggplot(he, wtp = 25000, pos_legend, graph_params, ...)

ceplane_plot_ggplot(he, ...)

# S3 method for bcea
ceplane_plot_plotly(he, wtp = 25000, pos_legend, graph_params, ...)

ceplane_plot_plotly(he, ...)
Arguments
- he
A
bceaobject containing the results of the Bayesian modelling and the economic evaluation.- wtp
Willingness to pay threshold; default 25,000
- pos_legend
Legend position
- graph_params
Graph parameters in ggplot2 format
- ...
Additional arguments
Value
For base R returns a plot
For ggplot2 returns ggplot2 object
For plotly returns a plot in the Viewer
Examples
# single comparator
data(Vaccine, package = "BCEA")
he <- bcea(eff, cost)
#> No reference selected. Defaulting to first intervention.
ceplane.plot(he, graph = "base")
 if (FALSE) {
# need to provide all the defaults because thats what
# ceplane.plot() does
graph_params <- list(xlab = "x-axis label",
ylab = "y-axis label",
title = "my title",
xlim = c(-0.002, 0.001),
ylim = c(-13, 5),
point = list(sizes = 1,
colors = "darkgrey"),
area = list(color = "lightgrey"))
he$delta_e <- as.matrix(he$delta_e)
he$delta_c <- as.matrix(he$delta_c)
BCEA::ceplane_plot_base(he, graph_params = graph_params)
## single non-default comparator
## multiple comparators
data(Smoking)
graph_params <- list(xlab = "x-axis label",
ylab = "y-axis label",
title = "my title",
xlim = c(-1, 2.5),
ylim = c(-1, 160),
point = list(sizes = 0.5,
colors = grey.colors(3, start = 0.1, end = 0.7)),
area = list(color = "lightgrey"))
he <- bcea(eff, cost, ref = 4, Kmax = 500, interventions = treats)
BCEA::ceplane_plot_base(he,
wtp = 200,
pos_legend = FALSE,
graph_params = graph_params)
}
data(Vaccine)
he <- bcea(eff, cost)
#> No reference selected. Defaulting to first intervention.
ceplane.plot(he, graph = "ggplot2")
if (FALSE) {
# need to provide all the defaults because thats what
# ceplane.plot() does
graph_params <- list(xlab = "x-axis label",
ylab = "y-axis label",
title = "my title",
xlim = c(-0.002, 0.001),
ylim = c(-13, 5),
point = list(sizes = 1,
colors = "darkgrey"),
area = list(color = "lightgrey"))
he$delta_e <- as.matrix(he$delta_e)
he$delta_c <- as.matrix(he$delta_c)
BCEA::ceplane_plot_base(he, graph_params = graph_params)
## single non-default comparator
## multiple comparators
data(Smoking)
graph_params <- list(xlab = "x-axis label",
ylab = "y-axis label",
title = "my title",
xlim = c(-1, 2.5),
ylim = c(-1, 160),
point = list(sizes = 0.5,
colors = grey.colors(3, start = 0.1, end = 0.7)),
area = list(color = "lightgrey"))
he <- bcea(eff, cost, ref = 4, Kmax = 500, interventions = treats)
BCEA::ceplane_plot_base(he,
wtp = 200,
pos_legend = FALSE,
graph_params = graph_params)
}
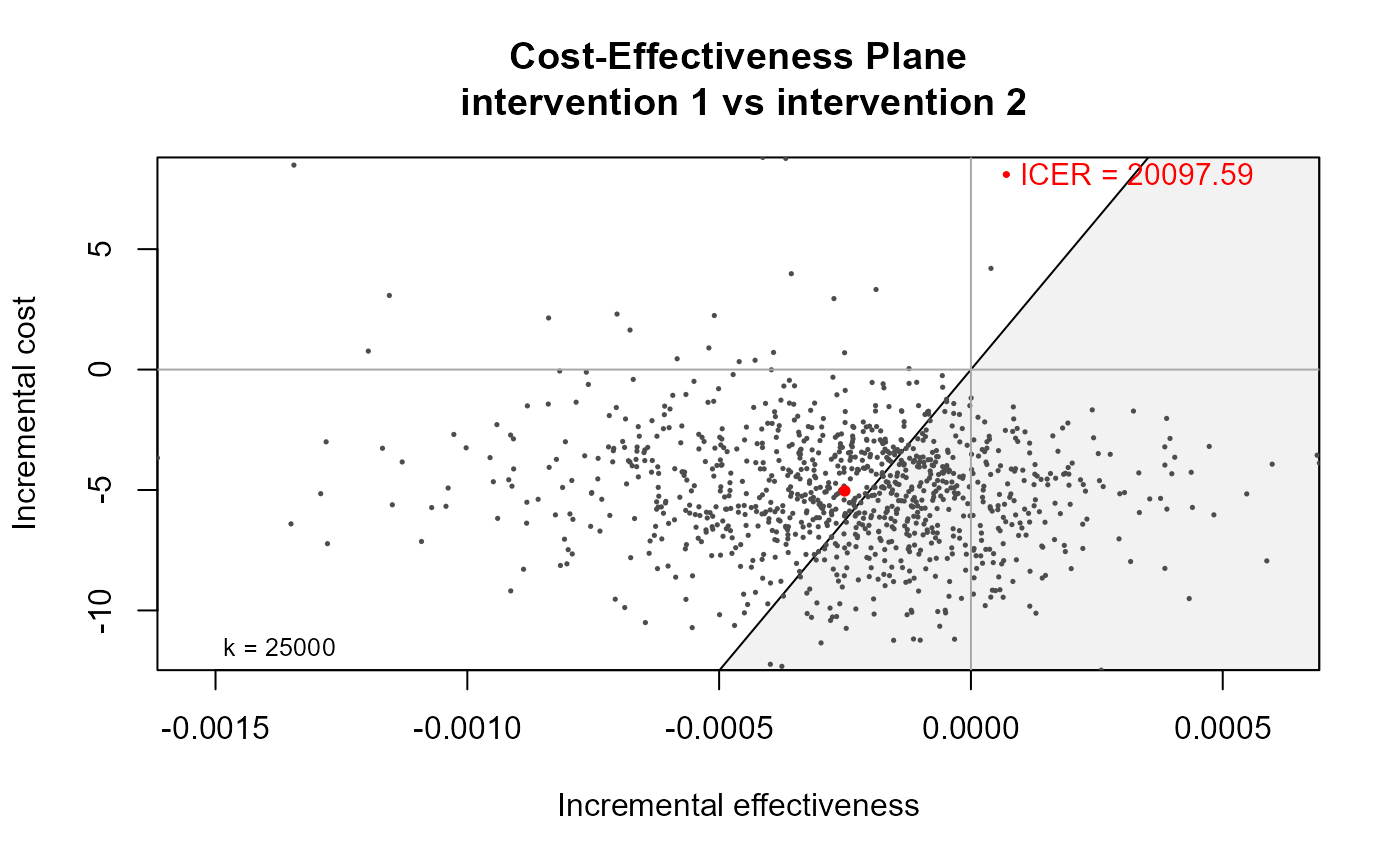
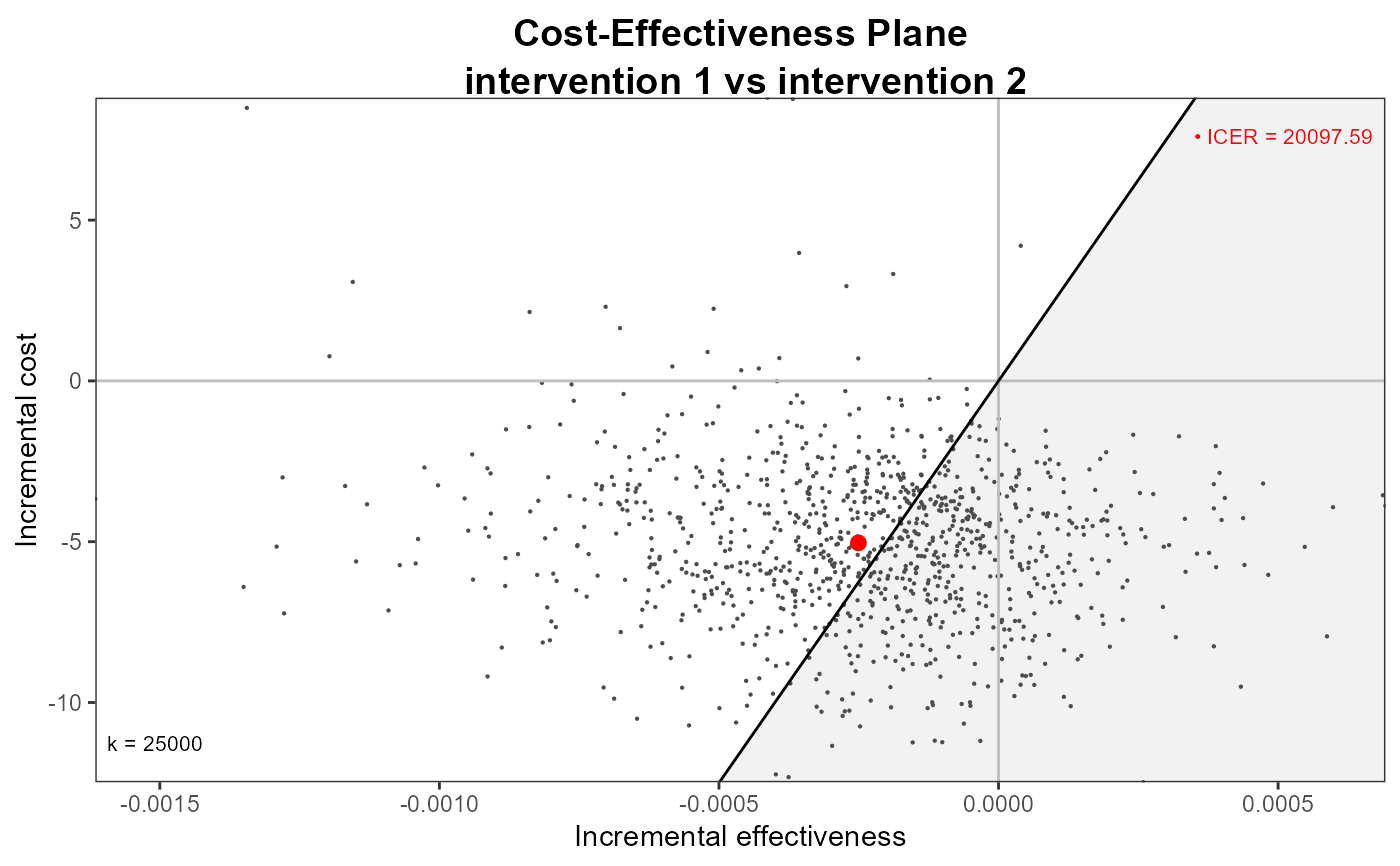
data(Vaccine)
he <- bcea(eff, cost)
#> No reference selected. Defaulting to first intervention.
ceplane.plot(he, graph = "ggplot2")
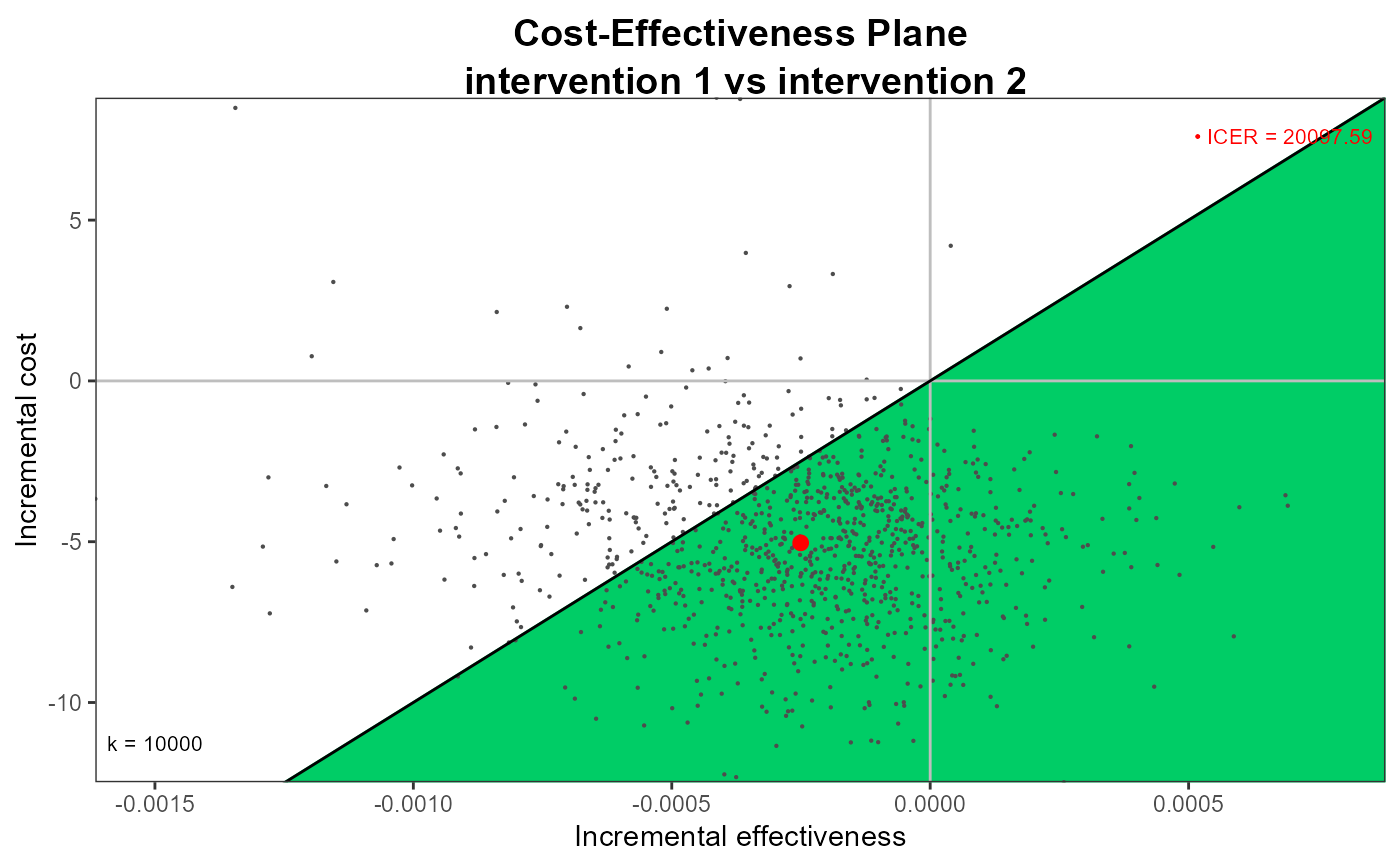
 ceplane.plot(he, wtp=10000, graph = "ggplot2",
point = list(colors = "blue", sizes = 2),
area = list(col = "springgreen3"))
ceplane.plot(he, wtp=10000, graph = "ggplot2",
point = list(colors = "blue", sizes = 2),
area = list(col = "springgreen3"))
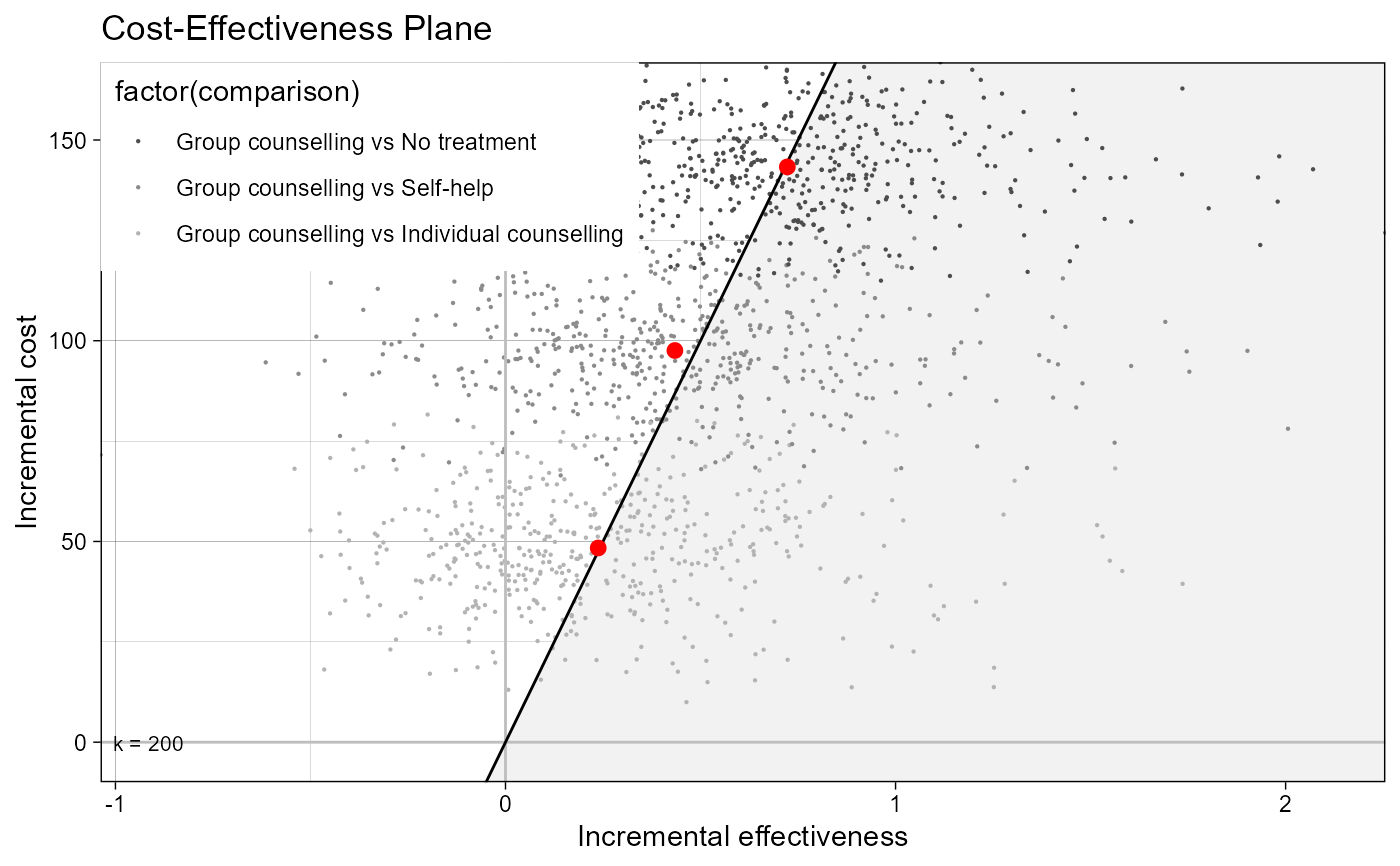
 data(Smoking)
he <- bcea(eff, cost, ref = 4, Kmax = 500, interventions = treats)
ceplane.plot(he, graph = "ggplot2")
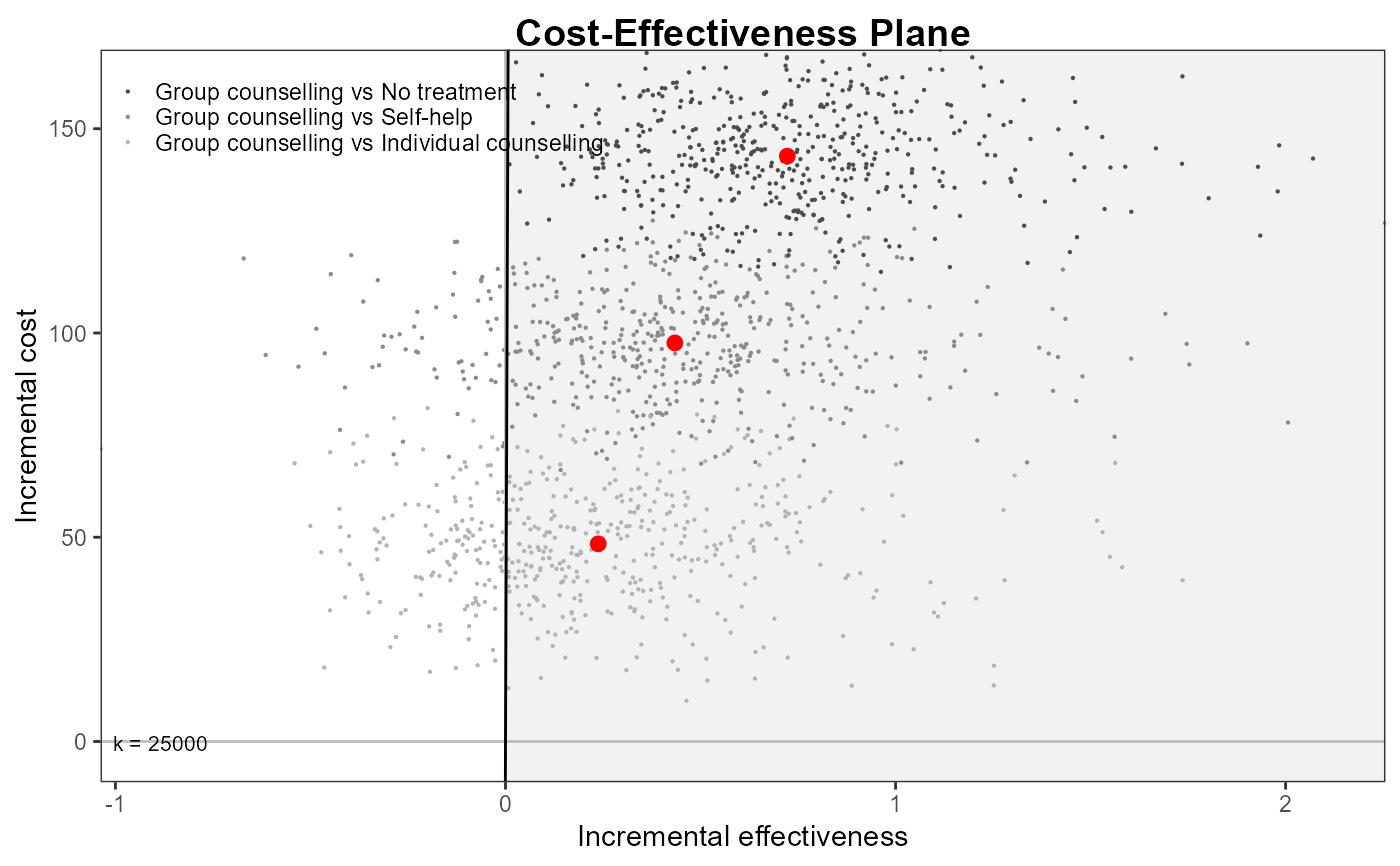
data(Smoking)
he <- bcea(eff, cost, ref = 4, Kmax = 500, interventions = treats)
ceplane.plot(he, graph = "ggplot2")
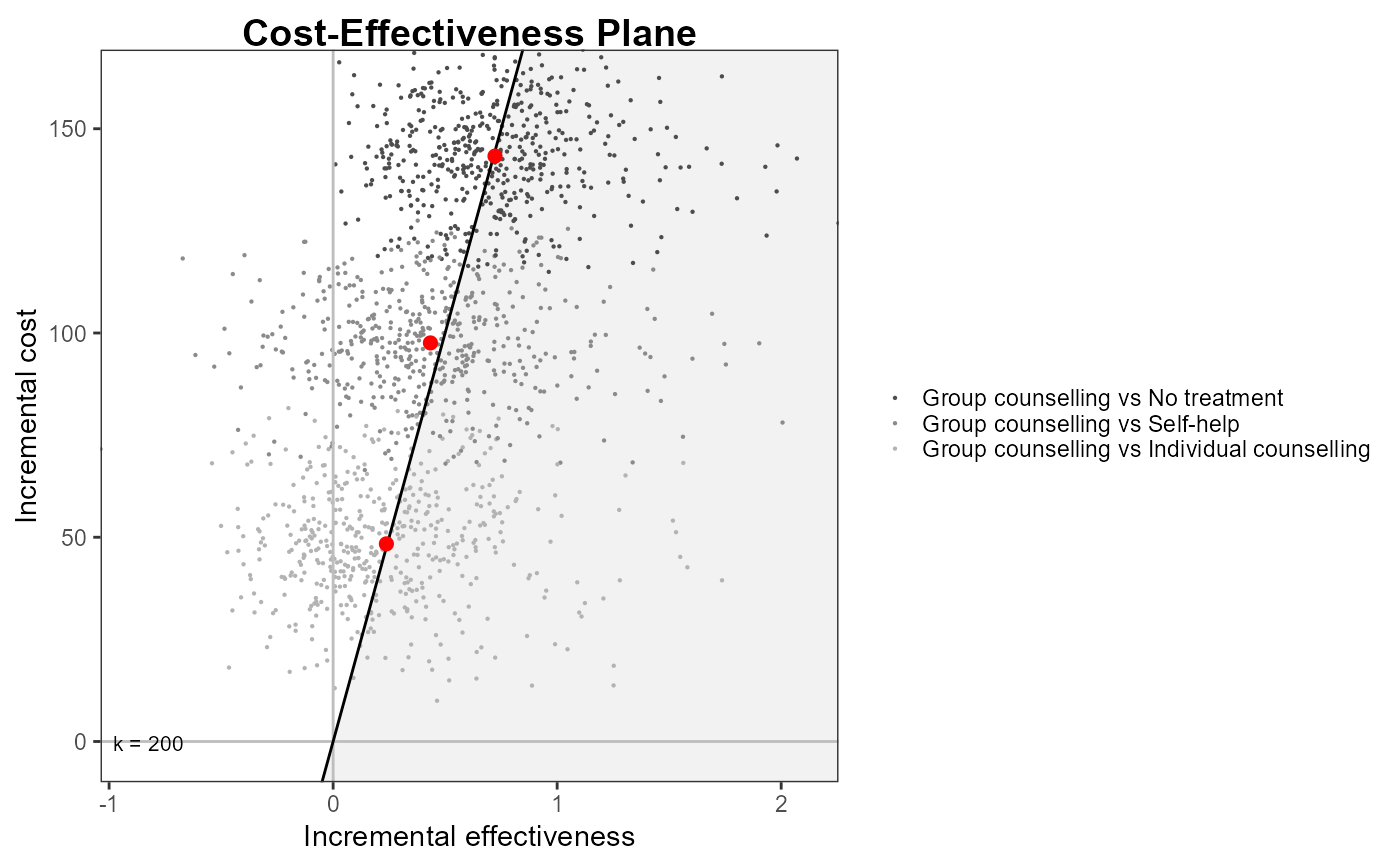
 ceplane.plot(he,
wtp = 200,
pos = "right",
ICER_size = 2,
graph = "ggplot2")
ceplane.plot(he,
wtp = 200,
pos = "right",
ICER_size = 2,
graph = "ggplot2")
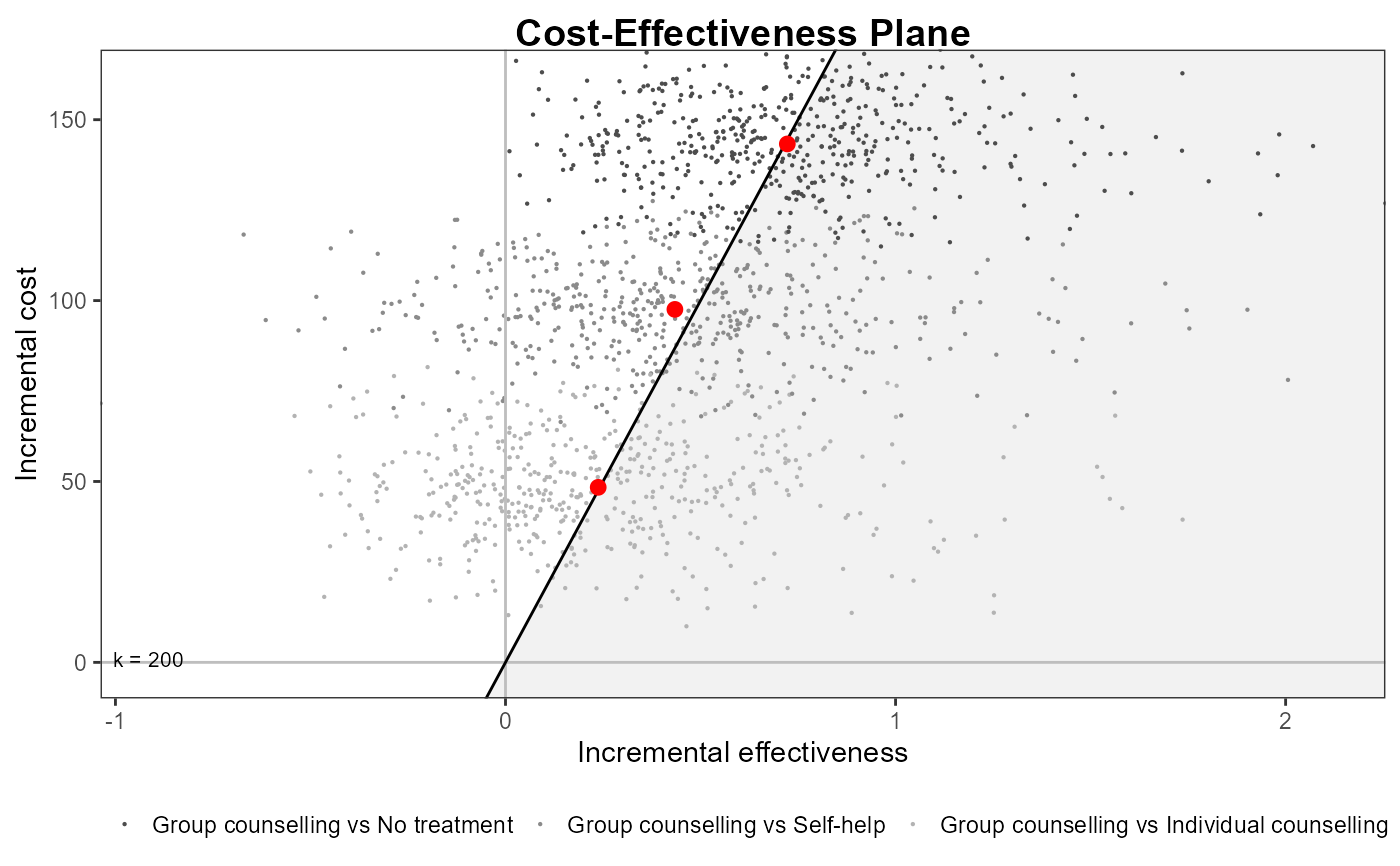
 ceplane.plot(he,
wtp = 200,
pos = TRUE,
graph = "ggplot2")
ceplane.plot(he,
wtp = 200,
pos = TRUE,
graph = "ggplot2")
 ceplane.plot(he,
graph = "ggplot2",
wtp=200,
theme = ggplot2::theme_linedraw())
ceplane.plot(he,
graph = "ggplot2",
wtp=200,
theme = ggplot2::theme_linedraw())