Summary plot of the health economic analysis when risk aversion is included.
Arguments
- x
An object of the class
CEriskav, a subclass ofbcea, containing the results of the economic analysis performed accounting for a risk aversion parameter (obtained as output of the functionCEriskav()).- pos
Parameter to set the position of the legend (only relevant for multiple interventions, ie more than 2 interventions being compared). Can be given in form of a string
(bottom|top)(right|left)for base graphics andbottom|top|left|rightfor ggplot2. It can be a two-elements vector, which specifies the relative position on the x and y axis respectively, or alternatively it can be in form of a logical variable, withFALSEindicating to use the default position andTRUEto place it on the bottom of the plot.- graph
A string used to select the graphical engine to use for plotting. Should (partial-)match the two options
"base"or"ggplot2". Default value is"base".- ...
Arguments to be passed to methods, such as graphical parameters (see
par()).
Value
- list(eib,evi)
A two-elements named list of the ggplot objects containing the requested plots. Returned only if
graph="ggplot2".
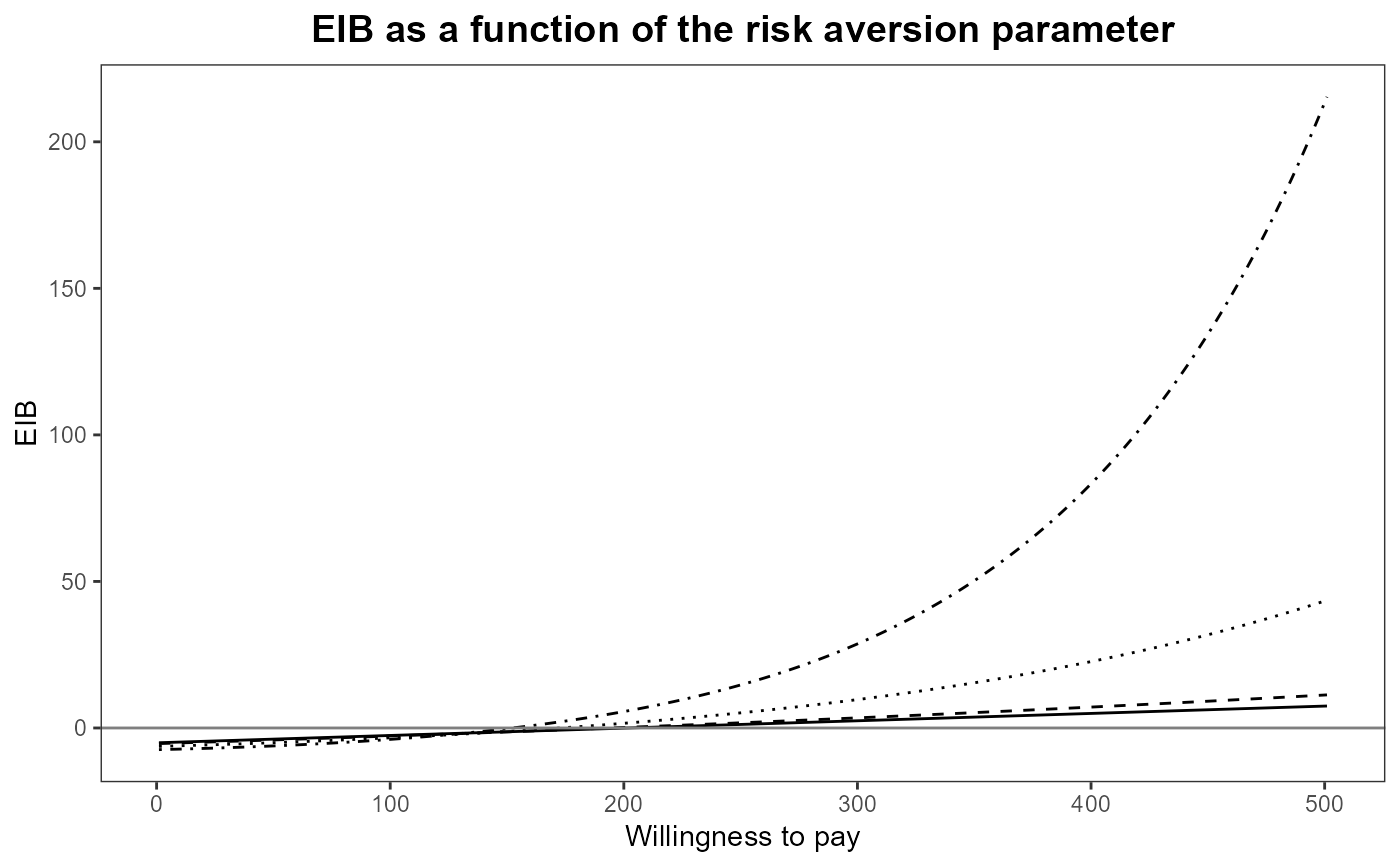
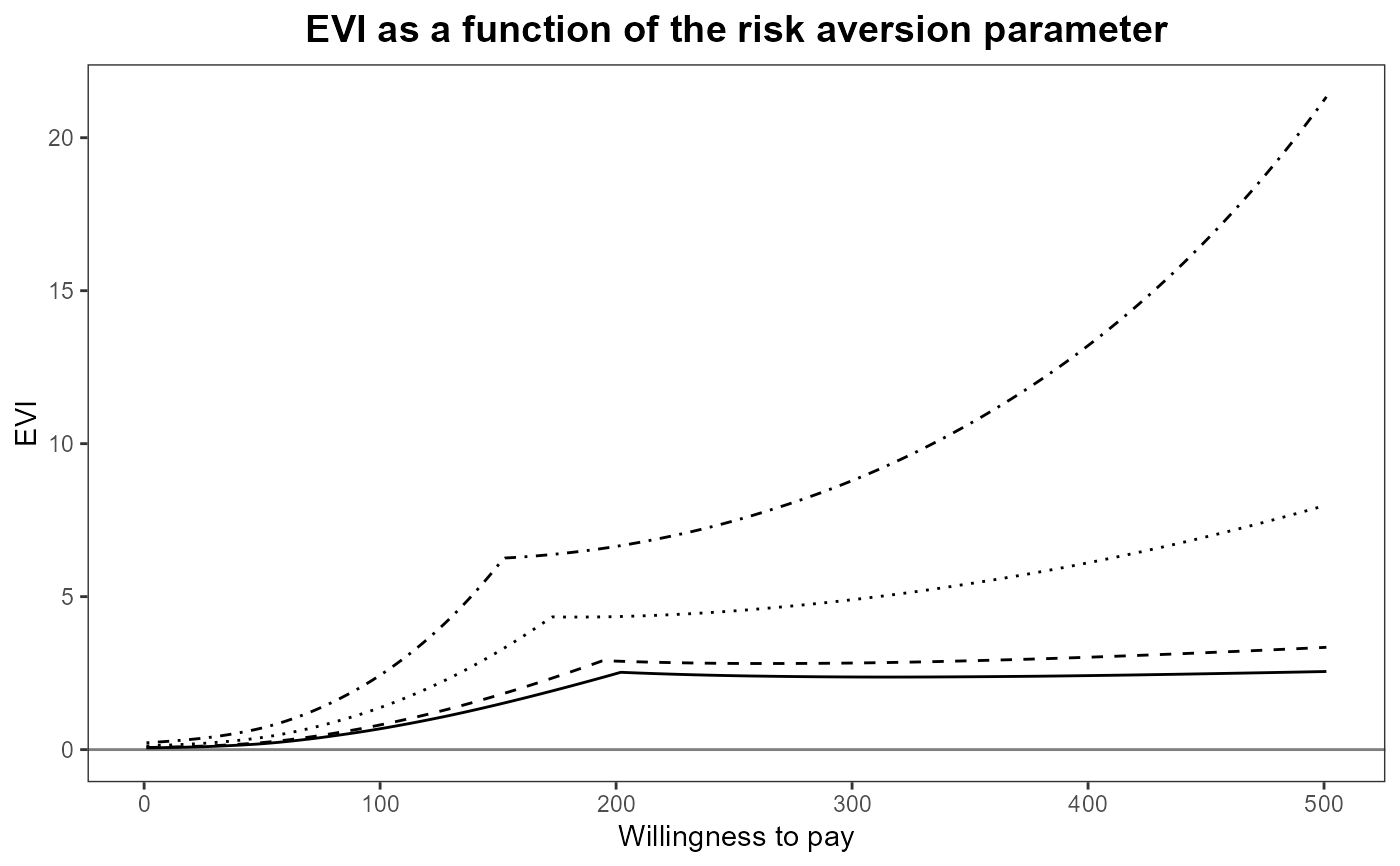
The function produces two plots for the risk aversion analysis. The first
one is the EIB as a function of the discrete grid approximation of the
willingness parameter for each of the possible values of the risk aversion
parameter, r. The second one is a similar plot for the EVPI.
Details
Plots the Expected Incremental Benefit and the Expected Value of Perfect Information when risk aversion is included in the utility function.
References
Baio G, Dawid aP (2011). “Probabilistic sensitivity analysis in health economics.” Stat. Methods Med. Res., 1--20. ISSN 1477-0334, doi:10.1177/0962280211419832 , https://pubmed.ncbi.nlm.nih.gov/21930515/.
Baio G (2013). Bayesian Methods in Health Economics. CRC.
Examples
# See Baio G., Dawid A.P. (2011) for a detailed description of the
# Bayesian model and economic problem
#
# Load the processed results of the MCMC simulation model
data(Vaccine)
#
# Runs the health economic evaluation using BCEA
m <- bcea(e=eff, c=cost,    # defines the variables of
                            #  effectiveness and cost
      ref=2,                # selects the 2nd row of (e,c)
                            #  as containing the reference intervention
      interventions=treats, # defines the labels to be associated
                            #  with each intervention
      Kmax=50000,           # maximum value possible for the willingness
                            #  to pay threshold; implies that k is chosen
                            #  in a grid from the interval (0,Kmax)
      plot=FALSE            # inhibits graphical output
)
#
# Define the vector of values for the risk aversion parameter, r, eg:
r <- c(1e-10, 0.005, 0.020, 0.035)
#
# Run the cost-effectiveness analysis accounting for risk aversion
# \donttest{
   CEriskav(m) <- r
# }
#
# produce the plots
# \donttest{
   plot(m)


# }
## Alternative options, using ggplot2
# \donttest{
   plot(m, graph = "ggplot2")


# }
## Alternative options, using ggplot2
# \donttest{
plot(m, graph = "ggplot2")
 # }
# }